
In this article I will be talking about why the Greenhouse Gas Protocol is broken and what we can do to fix it.
I will describe four changes that could have a big impact on how organizations deliver their promises to decarbonize. I will get down into the weeds somewhat but please bear with me – this stuff is important. The changes I am proposing are:
- extend Scope 2 to include all energy carriers such as Hydrogen, in order to avoid emissions ‘leakage’ to Scope 3
- introduce additionality rules around market-based reporting of Scope 2 emissions
- use GWP20 emissions factors instead of GWP100
- include Hydrogen as a greenhouse gas
I can almost sense your eyes glazing over. This looks uber-geeky, technical and deep into the detail of the GHG Protocol. But let me emphasize: these changes will have a huge effect on our ability to deliver urgent effective emissions reductions.
I have sought to bring this piece to life with real-world examples. My hope is that you, the reader, will understand the issues involved and share this post and help lobby for the changes proposed. The only way this will move the dial is if these changes are implemented. If you are connected with folks in the WRI or WBCSD who are responsible for the Protocol, please draw their attention to the points raised – we are in the territory here of ‘unintended consequences’ not deliberate miss-design, so please be nice!
OK, lets get started. If you are familiar with the GHG Protocol you can skip the next section.
What is the GHG Protocol?
The GHG Protocol [1] is the rule-book on how organizations report their greenhouse gas emissions. It focuses on five gases (CO2, CH4, N2O, NF3 and SF6) as well as two groups of chemicals (HFCs and PFCs). Yes, I know that there are other greenhouse gasses, but these seven are the most important – although I will be making a recommendation to add another gas, Hydrogen, to the list.
Because each of these gasses have different warming effects, they are always measured in ‘CO2 equivalents’ (CO2e) so that their total impact can be easily calculated. So, when we report the ’emissions’ of methane we report these in terms of the amount of CO2 that would have the same warming effect. These conversions are done using the Global Warming Potential, GWP, of each gas – with CO2 being 1, of course. Since greenhouse gases persist in the atmosphere for different lengths of time the GWP varies depending on the time-horizon used. By convention, the GWP specified in the GHG Protocol is the 100-year figure, but as we shall see later, this might not be the most appropriate.
The emissions arise from ‘activities’, that is to say things an organization does that directly or indirectly add any of the above greenhouse gasses to the atmosphere. An activity could be the number of liters of diesel I use in a car journey, or the amount of HFC gas that leaks from my chiller when I service it, or the amount of fossil gas I use in my hot water boiler. To calculate the emissions I take this quantity of diesel etc. and multiply it by the relevant emissions factor, which greatly simplifies things.
Every large country has its official source of emissions factors, such as the UK emissions factors [2]. It is important to use the correct factors because even though a fuel like diesel burns in the same way everywhere, it may be the case that UK diesel has some biodiesel blended in which makes its emissions different than, say, Australian diesel. Another reason to use the right country factors is because they are usually in the local units – in the UK we measure our vehicle fuels in liters, but in the US they are measured in gallons. Emissions factors also sometimes vary by year, so that, for example, emissions associated with grid electricity have declined over time as more renewable energy comes on stream.
As well as the official emissions factors, organizations may also use sector- or activity-specific emissions factors. For example a retailer could use average “ton per nautical mile” factors from the Global Logistic Emissions Council (GLEC) to estimate emissions that are created by importing goods from overseas.
The collection of activities and their resulting emissions are referred to as an emissions inventory. The GHG Protocol is very prescriptive about the way the emissions inventory is structured, so that organizations can be compared with one another and the right numbers are reported to authorities in places where mandatory emissions reporting exits. An important part of a sound inventory is making sure that the emissions factors used are the most reputable and that the activity data is measured in the most accurate fashion possible.
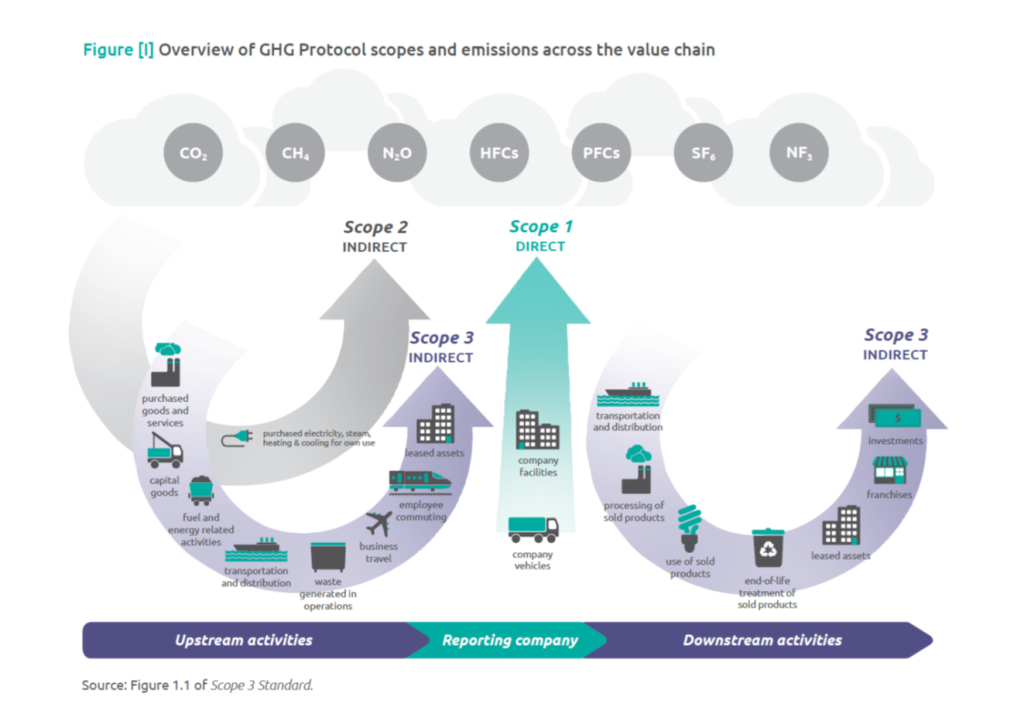
The GHG protocol requires folks to put emissions into three buckets or “Scopes”. To comply with the protocol an organization must, as a minimum, report its emissions in Scope 1 and in Scope 2, while Scope 3 is voluntary.
Scope 1 is for the direct emissions that occur when an activity causes one or more greenhouse gasses to be released into the atmosphere at the point the activity takes place. The car, chiller and boiler mentioned above are examples of energy-related Scope 1 emissions. Non-energy emissions that arise from land-use changes (such as peat removal, for example) would also be Scope 1 as would emissions from animal husbandry (such as from a dairy cattle herd).
Scope 2 is somewhat different to Scope 1 in that the emissions are indirect, in other words they happen away from the place where the activity happens. Scope 2 emissions are all related to the emissions use in creating four energy carriers – electricity, steam, heat and cooling, which an organization imports into its site.
Scope 3 emissions are all other indirect emissions that arise upstream or downstream of the reporting organization. The GHG protocol lists 13 different reporting categories for Scope 3 emissions. These are also called “value-chain emissions” which reflects the fact that, although the emissions arise from the activity of a third party, it is the reporting organization’s use of resources or services that gives rise to them.
An example of upstream emissions for a factory making cheese are the emissions that go into creating the milk that the factory uses, which are Category 1 (e.g. the emissions or ‘burps’ from the cows that produce the milk, the emissions from the electricity in the cow sheds and emissions from land-use-changes in creating the pastures) and the transportation of the milk to the farm in Category 4.
Normally one would draw the boundary for Scope 3 accounting one step up or down the value chain – hence the direct emissions at the farm would be counted (the share of the Farm’s own Scope 1 and 2 emissions that can be attributed to the milk), rather than continue to drill down into things which are Scope 3 emissions for the farm such as the emissions embedded in the supplementary feed that the cows consume in the winter.
Scope 3 emissions, as you can tell, are much more difficult to quantify, which is why many organizations prefer to focus efforts on reducing Scope 1 and 2 emissions than on digging into Scope 3. Even where companies do consider Scope 3 emissions, they often will focus on one or two really large effects and so their Scope 3 inventory is not complete. A detergent manufacturer, for example, would consider the energy that customers expend in their washing machines to be a big impact, compared to, say, staff travel to and from work.
Change # 1: extend Scope 2 to include all energy carriers such as Hydrogen, in order to avoid emissions ‘leakage’ to Scope 3.
As described above, organizations place greater significance on their Scope 1 and Scope 2 emissions than their Scope 3 ones. In many jurisdictions organizations are required to report these emissions in their Annual Reports and Accounts, in some places there may be levies of various kinds for these emissions. Investors and regulators expect to see very detailed discussions of Scope 1 and 2 emissions through annual reports to the CDP [3] (previously called the Carbon Disclosure Project).
Scope 1 and 2 emissions are considered to ‘controllable’ by the reporting organization and so the trends in these over time form an important indication of whether the organization is taking climate change seriously. Many organizations have declared targets to reduce Scope 1 and 2 emissions, in some case validated by the Science Based Targets institute.
By the same token, Scope 3 emissions are often considered ‘uncontrollable’, imprecise, incomplete and much lower priority (after all every organization’s Scope 3 emissions are another’s Scope 1 and 2 emissions). In short folks don’t generally pay nearly as much attention to these emissions even if they are reported.
So it is worrying to see that the current guidance in the Greenhouse Protocol has a loophole which will result in large amounts of emissions being removed from companies’ Scope 1 inventories and into Scope 3. This ‘core emissions leakage’ has the effect of encouraging organizations to make choices that can actually increase emissions overall.
Let me put that into a real-world example. I am working for Peel Ports Group on their ambitious NetZero plans [4]. They are adamant that they want a strategy that is science-based, aligned with keeping Global Warming to 1.5 deg C or less and that is completely irreproachable (in other words no fake ‘green electricity tariffs’, dodgy offsets or greenwashing).
One recurring theme in the maritime sector is the use of Hydrogen as an alternative fuel, replacing Marine Oil and diesel in a range of vessels and shore-based equipment. The Committee on Climate Change, for example, estimates that decarbonizing shipping will require a wholesale move over to Hydrogen as a fuel by 2050 at the latest. By the way, I am not sure Hydrogen is the right energy carrier – but that is a story for a different article.
This part of a decarbonization strategy is called ‘fuel-switching’, replacing one fuel with x emissions intensity for another fuel with y emissions intensity, and plays a big role in just about every sector’s plans. When I say fuel switching, I should point out that this can includes a switch which moves emissions from one Scope to another, such as switching from fossil gas in a boiler (Scope 1) to electricity (which is Scope 2).
But what if the fuel switch leads to emissions moving from Scope 1 to Scope 3? This is what I am calling ‘core emission leakage‘ and has profound implication because of the much greater emphasis on Scope 1 and Scope 2 emissions compared to Scope 3. Emissions that move from Scope 1 to 3 have the potential to disappear entirely from view.
Let us consider one fuel switching option for Peel Ports today: from diesel to electricity. For each kWh of diesel the UK 2022 emissions factor is 0.26955 kgCO2e/kWh whereas for electricity it is 0.19338 kgCO2e/kWh. A relatively small change you may think, but a diesel internal combustion engine is only 50% efficient (lots of energy is lost as heat in the exhaust) compared to an electric vehicles 95% efficiency, so overall there is a considerable emissions reduction and the change is to be recommended, especially given that we have high confidence that the grid electricity emissions factor is likely to decrease a lot further in the next decade as more renewables come on-stream.
Now lets look at switching from diesel to Hydrogen. 95% of Hydrogen available today is made from fossil gas with an emissions factor [5] of 0.328 kgCO2e/kWh – since the combustion efficiency is about the same as with diesel, switching to Hydrogen doesn’t bring any efficiency gains and in fact increases emissions by about 28% because of the higher emissions factor. However, the emissions in the Hydrogen arise at the point where the Hydrogen is made while in the combustion process on-site there are no greenhouse gas emissions at all. This means that the Scope 1 emissions using Hydrogen are zero and the indirect manufacturing emissions, under the current GHG Protocol rules would be treated as Scope 3 emissions (strictly Scope 3 Category 3a “indirect emissions from fuels”). This is an example of core emissions leakage.
The problem is that if, like most organizations, the emphasis is on reducing the Scope 1 and Scope 2 totals, then the move to Hydrogen appears very attractive compared to electricity, since all those diesel Scope 1 emission simply disappear. The fact that emissions as a whole rise is not important since in many cases Scope 3 emissions are not even reported. Indeed even if Peel Ports did report the Scope 3 emissions, these are so large that the addition of the Hydrogen emissions to this part of the inventory would have minimal effect to the totals.
This situation is very concerning given the quantity of energy carriers like Hydrogen expected to be used in some sectors in the future.
But the GHG Protocol has already solved this problem for another group of energy carriers – electricity, steam, heat and coolth whose emissions arise offsite, but are recorded as the organization’s own emissions in Scope 2. Indeed, it is because electricity is a Scope 2 emission that organizations become deeply concerned about its provenance and can implement further decarbonisation strategies like switching their electricity supply from a grid average to a 100% renewable source. Not a ‘fuel switch’ in this case but a ‘source switch’, if you like. These Scope 2 emissions are genuinely controllable by the reporting organization because, as well as managing the quantity of the carrier they use, the organizations would usually have access to a range of suppliers in the marketplace with a range emissions intensities. The GHG protocol has created the notion of ‘market based reporting’ to encourage folks to select lower-emissions sources as part of their decarbonization journey.
Hydrogen is comparable in every way to electricity. It is an energy carrier, i.e. a form of energy which has to be made. There are a range of technologies in its manufacture which offer widely different different emissions intensities (the so-called colours [6] of hydrogen, black, grey, blue and green etc). The problem is that the current rules provide no real incentive for buyers of Hydrogen to consider the color or emissions intensity of their supply.
Moving Hydrogen to Scope 2 along with the other energy carriers would eliminate the core emissions leakage and lead to organizations becoming very engaged with the provenance of the hydrogen they use. For example, they could source the hydrogen from a ‘green’ manufacturer that makes it by electrolysis using renewable electricity. It would probably cost more than the grey hydrogen I have described so far, but that would be a decision for the organization to take.
By treating Hydrogen as a Scope 2 emissions carrier I could develop a range of decarbonisation ‘fuel switch’ alternatives for PPG: diesel to grid average electricity (approximately halves emissions), diesel to 100% renewable electricity (eliminates emissions), diesel to ‘grey’ Hydrogen (increases emissions by a quarter, so highly unlikely) and diesel to ‘green’ Hydrogen (eliminates emissions). Each of these would have different costs (grid and renewable electricity have different prices as well as grey and green Hydrogen). The key point is that the decision-making would be much better informed without any perverse incentives to make choices simply because they move emissions from one reporting slot to another.
This would also eliminate another real-world issue with Hydrogen. Most Hydrogen today is used in industrial processes like Ammonia (fertilizer) manufacture and is usually made on-site, which means that all the emissions used in the manufacture are part of the factory’s own Scope 1 or 2 emissions inventory. However if, as some folks are forecasting, a large market for Hydrogen develops and it becomes widely available, the Ammonia manufacturer may choose to cease making it on-site and instead buy in so-called “merchant” Hydrogen. In the current rules all the emissions related to Hydrogen would completely disappear in a flash. Indeed there would be little concern about which form of “merchant” Hydrogen was selected since the emissions only appear as Scope 3.
So, in my humble opinion, the first urgent change to the GHG Protocol must be to mandate that organizations report emissions from any energy carriers in their Scope 2 inventories. Energy carriers would include any ‘fuel’ that is manufactured such as Hydrogen, Ammonia and other so-called “PowerToX” fuels like as eMethanol, but not fuels like diesel where the energy is already present in the molecules and any processing is largely about refining or concentrating the fuel.
Lets take a look a final real-word example, involving the synthetic fuel eMethanol. Unlike the other energy carriers I have mentioned so far, burning methanol creates some direct GHG emissions in the form of CO2. These emissions are the same regardless of how the methanol is made and would, as with any other combustion process that produces CO2, be reported in the user’s Scope 1 emissions.
However eMethanol produced chemically using ‘green’ Hydrogen, water and CO2 would actually have a negative Scope 2 emissions factor in manufacture because of the CO2 taken out of the atmosphere and incorporated into the molecule. In addition to the Scope 1 emissions from the combustion of the eMethanol the user would also report negative emissions in Scope 2 due to the CO2 utilized in its original manufacture.
Reporting different aspects of the same activity in different scopes and Categories is already established practice in the GHG Protocol, so there is nothing new here. This is an elegant solution where the organization uses both conventional methanol and synthetic methanol where they would report the overall Scope 1 emissions based on the total volume used and get a Scope 2 ‘credit’ of negative emissions for the quantity that was sourced from the green supplier.
In summary, the current guidance does not create a level playing field for decarbonization alternatives or drive organizations to make better informed decisions. Indeed, it also disadvantages lower-emissions producers of Hydrogen or other energy carriers in the marketplace. The ‘core emissions leakage’ from Scope 1 to Scope 3 has the potential to undermine the credibility of the GHG Protocol and could lead to organizations ‘gaming’ the system in order to appear to be decarbonizing more rapidly than they truly are.
Finally, I would also touch on an alternative to my proposal, which would be to create an additional Scope 2 Category of emissions called “Upstream” and then report all emissions currently reported in Scope 3 Category 3a here. That would have the effect of avoiding the core emissions leakage, but would have the disadvantage that many of these upstream emissions are not controllable by the organization – such as the T&D losses in the electricity networks or the emissions at the refinery producing the diesel used or further upstream in the extraction of the oil in the first place. It would also mean that for organizations who are not using these new energy carriers like Hydrogen, there would still be a change in their reported emissions that would need to be explained in their reports. On balance, I don’t favor this solution.
Change #2: introduce additionality rules around market-based reporting of Scope 2 emissions
A big bugbear of mine, as readers of my articles on LinkedIn will recognize, is the way that some companies have (and continue to) use ‘green electricity tariffs’ to claim zero emissions for their electricity.
Up until 2015, emissions were accounted for on a location-based reporting basis which means their Scope 2 emissions, like electricity, would be reported using the grid-average emissions factor for their country or network (hence “location-based”). But then the WBCSD and WRI introduced a new approach called market-based reporting, which allows organizations to report their emissions based on the specific supply that they receive. This step was what opened the floodgates to corporate ‘greenwashing’ on an industrial scale.
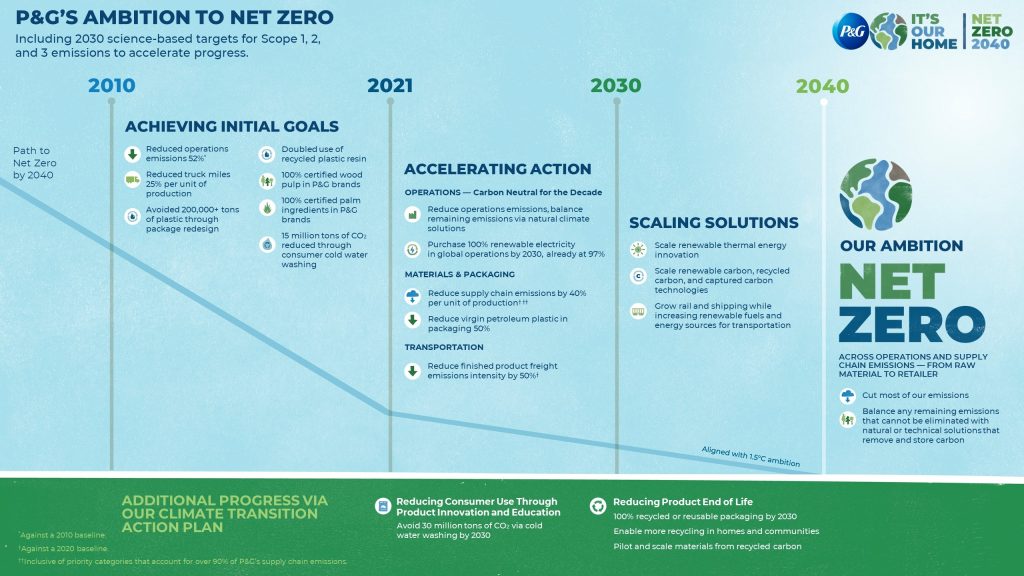
I will use a real-world example to illustrate my concerns. Procter & Gamble is the world’s largest consumer goods company, headquartered in Cincinnati in the US. In their 2021 “Climate Transition Action Plan” [7, page 5] they boldly claim that by 2030 they will “purchase of 100% renewable electricity in global operations by 2030, already at 97%” and also that the plan is “Aligned with 1.5°C ambition”. I am sure that many folks will be impressed by this target and the progress to date. However, P&G’s true contribution to renewable generation is very much smaller than this claim suggests.
The reason that they can make this claim is that, in many markets, each MWh of renewable electricity produced is accompanied by a certificate showing that it came from a renewable source. In the UK these certificates are called Renewable Energy Guarantees of Origin, REGOS. In some cases, these certificates come when the company buys electricity from a renewable generator (“bundled”), or in other cases they can be simply brought from renewables generators separately to the electricity (“unbundled”). Europe has REGOS and other countries have Renewable Energy Certificates (RECs) or international iRECs, but they are essentially the same.
It was the 2015 GHG Protocol changes that allowed companies to use certificates like REGOS to report zero market-based emissions for their electricity.
Now anyone making an environmental claim should only do so if they are claiming something that has arisen because of their action made it happen. If my neighbor pays to put up solar panels, I can’t legitimately claim to have helped my street become greener. The ‘truthfulness’ test is called additionality – did your actions directly result in the additional environmental benefit that you are claiming. If it would have happened anyway, then you can’t lay claim to it as a result of your own action. It’s as if I give a donation of £100 to charity and then someone else comes along and gives them £1 for a certificate to claim the ‘bragging rights’ to my donation for themselves.
In P&G’s case in the UK and in many other markets, simply obtaining x MWh of REGOs does not mean to say that P&G paid for or contributed to the creation of x MWh of renewable generation. The cost of developing renewable generation is covered by ‘green levies’ on all electricity user’s bills and amounts to something like £40 per MWh compared to the cost of REGOs of under £1 per MWh in 2021. The REGOS are clearly not evidence of additionality since they do not pay for more renewable generation. By buying the REGOs, P&G is in effect saying to other electricity users who did pay their share of the green levies that
Sorry, that’s our green electricity now, we are claiming it for ourselves, even though you actually paid the extra to produce it
I am not alone in considering that REGOs should not count towards organization’s NetZero claims or Scope 2 emissions calculations. These are now banned in other standards like the UK Green Building Council’s NetZero Operations guidance on green energy [8] and have been a subject of concern in the Science Based Targets institute’s methodology [9]. Way back in 2012 when the Carbon Reduction Commitment regulations started, they were also banned from those regulations. Indeed, the stink around these claims has now become so profound that the UK Government has called for an investigation [10] to tighten rules to stop ‘greenwashing’ of electricity tariffs. The media too are picking up on these issues as an excellent article [11] from S&P Global points out and a recent paper [12] by Anders Bjørn et al, in Nature Climate Change concluded:
Our study shows that the common voluntary corporate practice of using RECs that are unlikely to drive additional renewable energy production casts serious doubt on the veracity of reported corporate emission trajectories and their apparent alignment with the most ambitious Paris Agreement temperature goal.
Exactly my concerns, of which the P&G Carbon Transition Plan is a classic example.
The reason why REGOS allow companies to claim zero emissions is because of the rules that the GHG Protocol has put in place around market-based reporting.
I don’t know why this has come about, whether because of regulatory capture by groups such as the RE100 looking for ‘easy’ routes to claim action on climate change, or because corporate members of the WBCSD or WRI have applied pressure, but the result is the same – we have a system that allows organizations to make trivial investments to expropriate for themselves the contribution of all electricity consumers and society at large and claim the ‘greenness’ for themselves.
The GHG Protocol Scope 2 Guidance [13] focuses heavily on the notion of certificates like REGOS (“energy attribute certificates”, “instruments” etc) as the basis for market-based reporting. It goes into intense depth about aspect about how these certificates should operate such as vintage, retirement, uniqueness, boundaries, but does not impose a requirement of additionality.
They are quite forthright about this [13, page 90]:
‘This guidance does not require that contractual instruments claimed in the market-based method fulfil criteria such as offset “additionality” or prove the overall market impact of individual purchases or supplier programs result in direct and immediate changes in overall supply.’
and further down
‘Offset additionality criteria are not fundamental to, or largely compatible with, the underlying rules for market-based scope 2 accounting and allocation.’
Notice the use of the clunky expression ‘offset additionality’. The GHG Protocol are saying that the notion of additionality is reserved for offsets, which are direct investments in emissions reduction projects with before and after emissions data. Electricity generation is different, they say, because
‘Scope 2 reporting is a report of usage and as such is independent of issues associated with additionality’
Well, a whole load of folk disagree with that position.
Emissions reporting by businesses is meant to be transparent and honestly reflect the actions that the organization is taking to reduce is impacts. Stakeholders are looking at progress against Scope 1 and 2 targets to assess how organizations are responding to the climate emergency. There is no room for a rule that allows organization to cheaply report reductions which they have had not part whatsoever in creating. This is why additionality needs to be firmly introduced into Scope 2 market-based reporting in the GHG Protocol.
One of the problems with the current rules is that renewable supplies which organizations have actually paid to develop, and do demonstrate additionality, are disadvantaged. A company wanting to support renewable generation (such as an offsite solar farm) typically enters into a long-term Power Purchase Agreements (PPAs), where the company commits to a long-term price for the renewable electricity which means that it can be produced without public subsidy. The last point is important – the public subsidy is there to support the government’s emissions targets, so if it is not spent on the PPA project, it is available to spend elsewhere, and so the generation provided through the PPA is genuinely additional to that which would otherwise have occurred. But PPAs cost more than standard tariffs with additional REGO top-ups.
Furthermore, organizations who believe that they are consuming 100% renewable electricity will tend to consider that its “job done” in terms of emissions (after all you can’t get lower than reporting zero emissions) and so will do less in terms of energy efficiency. My son, Connor Enright did his Master’s on this subject which I discuss in a previous LinkedIn article [14] where one of the key finding is that
Corporations with high market-based emissions savings have a lesser energy efficiency response.
That is to say that reporting big emissions reductions using market-based emissions factors based on REGOs and other certificates, leads to lower action on energy efficiency.
Another of the findings is that the use of these certificates to report lower emissions is greatest in consumer-facing businesses where the customers are somewhat less informed about emissions than corporate customers, as well as significantly higher in RE100 corporations. The RE100 is a club of businesses that have been using REGOS for years to bolster their apparent emissions reduction efforts, based on the argument that “if enough companies want REGOs then their price will rise and they will then genuinely support additional renewable generation”, something that has never happened.
So, let’s dig down into P&G’s 97% renewable electricity purchase and try and establish how much the company has relied on REGOs. Like many companies, P&G provides detailed data on its emission as part of its CDP report [15], which is publicly available. The CDP requires that organization specify the sourcing method for their Scope 2 market-based supplies in response to question 8.2e.
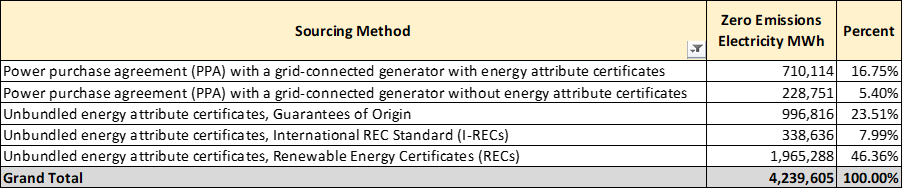
What this table is telling us is that approximately 78% of P&G’s zero/low emissions claims are based on buying REGOs or equivalent. Since these are “unbundled”, the actual electricity they bought could have come from any source including coal-fired power station. The remaining 22% of electricity may or may not have been additional as the PPA could be based on a supply that is receiving public subsidy, so the proportion that demonstrates additionality, is probably at best, 22%.
Now I hasten to add that nothing P&G has done is illegal or deliberately misleading. While the claim of “97% renewable electricity” is strictly correct, since P&G has the certificates to prove it, the implication that many people would draw that this has resulted in a positive contribution to the environment or climate change is not. The REGOs were issued after the event, after someone else paid for the generation capacity to be built.
Many organizations have woken up to the fact that REGO-based Scope 2 emissions reduction claims lack integrity and are taking steps to move away from these. In their renewable electricity transition roadmap [16], the major UK retailer Tesco divides renewable sources into three categories:
1. Renewable certificates: low credibility/customer recognition
2. Grid Power Purchase Agreements (PPAs): high credibility / medium customer recognition
3. On-site generation: highest credibility/customer recognition
This confirms that other large consumer-facing organizations are having second-thoughts about REGO-based claims, in this case branding them as “low credibility”. Further into the P&G report [7, page 20] we can detect that P&G also recognize some drawbacks:
While the purchase of unbundled renewable energy certificates (RECs) has been and will remain part of our renewable energy portfolio, our primary focus will continue to be development of new renewable energy projects that bring long -term, zero emissions renewable energy capacity on-line.
But even a PPA where the renewable technology is 100% funded may currently rely on grid-reinforcement by other actors on the system. This is a second-order additionality consideration which currently does not undermine the basis for claiming fully-funded unsubsidized PPAs as an intervention leading to additional renewable generation.
Given the exposure of many organizations like P&G to market-based reporting using REGOs and other certificates, I expect that there will be a fierce backlash against this change, not least because of the influence of actors like the RE100 and renewable electricity providers who have a lot invested in the notion of REGOs driving change.
However, the bottom line is that the current market-based reporting rules actually impede action on climate change and can lead to increased emissions, so they have to change.
Change #3: Use GWP20 emissions factors instead of GWP100
This is the rule change that I least expect to achieve traction, but which is very important if we are to encourage our reporting systems to drive effective action on climate change.
In my introduction to the GHG Protocol, I mentioned that Global Warming Potentials are used to “normalize” the warming impacts of different greenhouse gases to that of CO2.
The definitive source of the GWPs is the Intergovernmental Panel on Climate Change (IPCCS) who updated these in the Assessment Reports, published ever few years. By definition, the GWP of CO2 is set at 1 but the GWP of the other two major gases, Methane and Nitrous Oxide change slightly as the scientific understanding improves. The IPCC calculate the GWP over a 20, 100 and 500 year time-frame. GWP20 and GWP100 are shown in the table below.
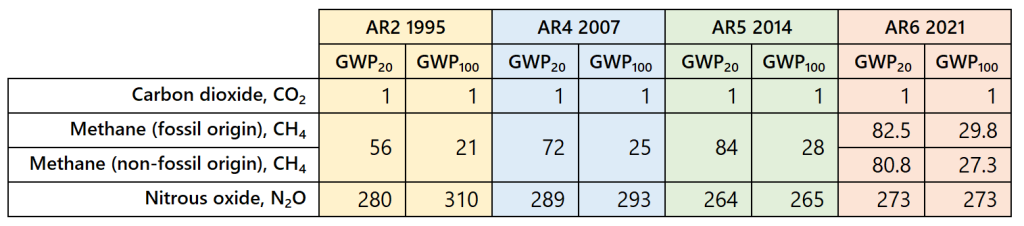
Ignoring the small changes between the Assessment Reports due to more detailed scientific data, we can see that Methane is the only greenhouse gas which has a markedly different GWP20 and GWP100. That is because the lifetime of CO2 in the atmosphere is well over 100 years, that of Nitrous Oxide is 114 years but Methane is broken down after only 12 years. For this reasons Methane is called a short-lived climate pollutant (SLCP).
The GHG Protocol states [17] that:
When using the Corporate Standard, companies: a. Shall use 100-year GWP values from the IPCC.
I am not sure why the 100-year period has been selected – the only rationale for this seems to be that these are the time-frames used in the Kyoto Protocol which mandate that national inventories must use 100 year values from the Second Assessment Report (AR2). It is certainly is the case that GWP100 is the most-widely used version in academic papers and so can be considered the default. However the GHG Protocol says [17. page 6]:
the choice of time horizon reflects the weight attached by policy makers to the short and long-term costs and benefits of different climate change policies
So, is the 100-year factor the most appropriate? When folks create emissions inventories using the GHG Protocol the intention is to understand and report the relative impact of the various greenhouse gases they produce to prioritize reduction efforts and to provide visibility to stakeholders on their impact and emissions-reduction performance.
The choice of GWP100 really doesn’t affect the emissions reporting on CO2 or N2O but it reduces the apparent impact of methane during the time it resides in the atmosphere. Indeed, though the latest GWP20 of methane is around 81, that is likely to be an understatement since Methane is in the atmosphere for only 12 of the 20 year period – its true GWP12 is likely to be in the order of 120x that of CO2.
So, lets consider what the real-world implications of this might be. I took the overall emissions of the USA from the Environmental Protection Agency (EPA) website [18] as my starting point, reproduced in the chart on the left, using the GWP100 factors, from which, given the total emissions, I could easily calculate the mass of the gases. I then applied the GWP20 factors to those masses, to arrive at the chart on the right.
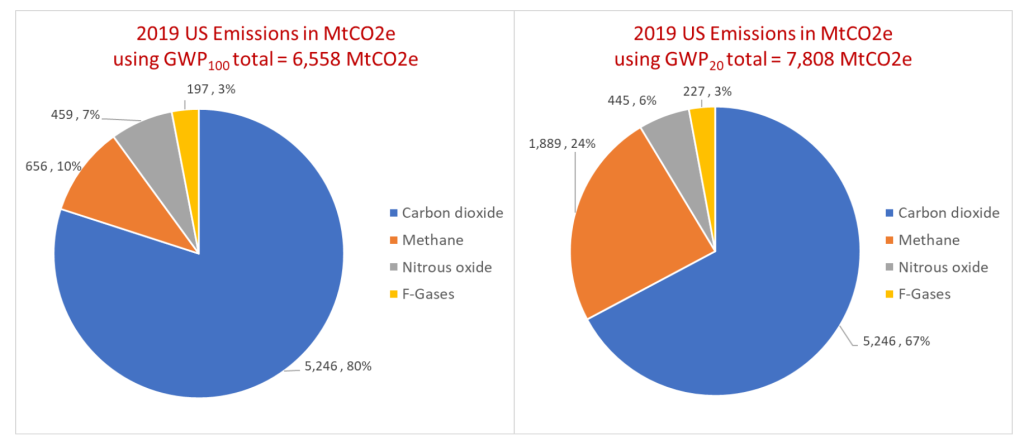
Now there is quite an amazing difference in respect of Methane. It goes from being just 10% of the US’s total emissions to almost 25%, reflecting the difference between the GWP100 of 25 and the GWP20 of 72 (the EPA uses the AR4 factors so I stuck with these for this exercise – if we had used the AR6 factors the difference would have been larger still).
We should also note that using a GWP20 figure, the US total emissions have increased from 6,558 MtCO2e to 7,808 MtCO2e an increase of 19% due to the greater CO2 equivalence of methane. By the way, I didn’t adjust the F-gas calculations but these would have been a slightly larger proportion in the second scenario, but wouldn’t have affected the huge change in emphasis around methane.
In the US is a lot of pressure [19] from environmental NGOs and scientists for the EPA to use GWP20 to instead of GWP100, because this more realistically measures the impact of short-lived emissions sources like Methane:
Using the 100-year GWP “falsely dilutes the impact of methane emissions, and undermines the urgency of taking the steps necessary to avoid climate catastrophe”.
Indeed, there is some debate that the EPA figures may also be underestimating [20] the mass of methane emitted by as much as half.
How we control Methane emissions is becoming central to our climate change strategies. This is because the warming that we are currently seeing is at the upper end of predictions and scientists are becoming increasingly concerned that we might be approaching climate “tipping points” where the effects of warming set off positive feedback loops. Thus, the emphasis is changing from limiting overall greenhouse gas concentrations in the long-run to limiting immediate warming.
It is clear that the climate emergency dictates rapid decarbonization of all sectors of our society. We need to, as a minimum, halve emissions this decade and achieve NetZero by 2050 at the latest, ideally by 2040. Our emphasis in the over two decades since Kyoto has moved from the long term to the short term.
The central role that Methane plays in the short term is set out [21] by the Environmental Defense Fund:
In the next decade, methane from all sources will do more to warm the planet than the burning of fossil fuels.
But this very potency also means that cutting methane emissions offers the fastest way to slow global warming. EDF has found that a rapid, full-scale effort to reduce methane emissions from oil and gas operations, agriculture and other sectors could slow the worldwide rate of warming by as much as 30%.
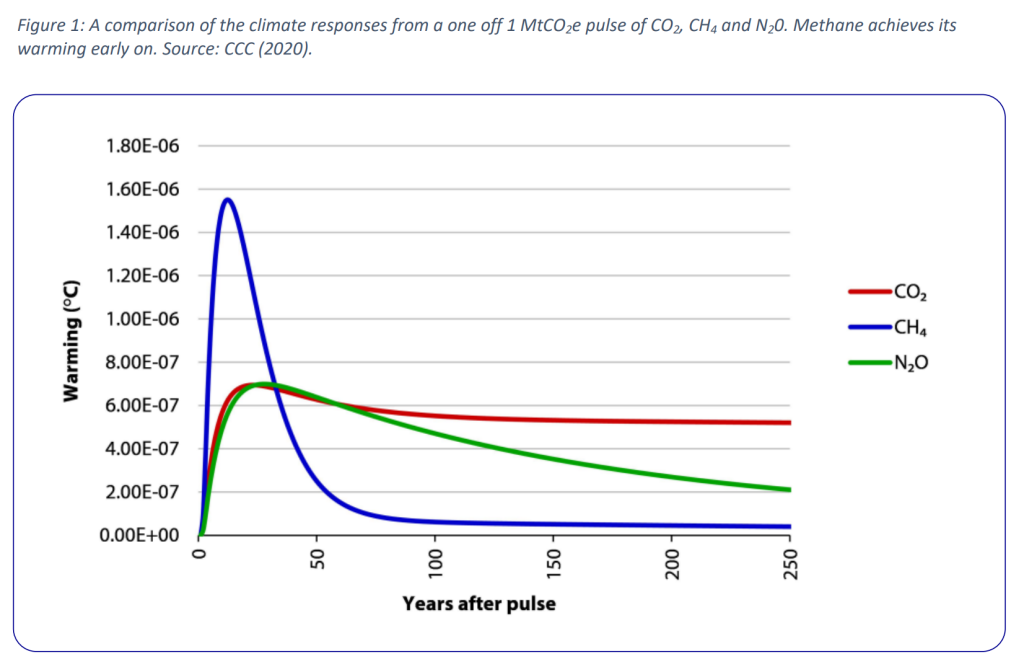
Paul Gilding, a Faculty member of the Cambridge Institute of Sustainability Leadership (CISL) has also written about the need for Methane to take center stage in the climate debate. One chart in his 2022 paper [22] illustrates the relative impact over the next decade of Methane compared to the other major greenhouse gases. In each case we have added 1 MtCO2e of the gases to the atmosphere, but the Methane has an immediate and much higher warming effect – precisely what we need to avoid.
Clearly, given the change in emphasis from long-term to short term strategies, the focus on immediate warming and the recognition that the effect of Methane emissions are under-stated by the current GHG Protocol’s use of the GWP100 factors, the time is now right to mandate the use GWP20 factors.
This would have the effect of more clearly signaling to organizations that Methane is a significant and urgent problem. It will place added emphasis on actions in sectors which have high methane emissions: oil and gas companies which have high levels of methane leakage, agriculture and waste management. It will support the introduction of policies such as the US Inflation Reduction Act introduced by the Biden administration which includes very large penalties [23] ($900 per ton, rising to $1,500) for Methane leaks from the oil and gas sector.
In practical terms the transition from GWP100 to GWP20 involves multiplying the relevant emissions calculated using GWP100 by the GWP20/GWP100 factor using the correct AR dataset. For AR4, for example, direct methane emissions would be multiplied by 72/25 = 2.88. In some cases, organizations will not have separately tracked the CO2, N2O and CH4 components of each activity, as recommended in the GHG Protocol, but instead used a CO2e emissions factor that combines all of these. In that case they would have to separate out the gases and calculate the CO2e figures again, which could be fiddly. I expect, though, if the GHG Protocol makes the change to GWP20 the national and sectoral emissions factors tables will all be updated accordingly. These challenges are not insurmountable and it may also be the case that organizations whose SLCP (Methane and HFCs) emissions are below a certain de minimis may be able to continue reporting using GWP100 for a period.
The case for updating the GHG Protocol to use shorter term Global Warming Potentials is overwhelming. It is clear that this will lead to better, more focused and effective action to reduce emissions.
BTW, I have previously written a LinkedIn article [24] on the subject of alternative measures for the climate impacts of “short lived climate pollutants”. These are greenhouse gasses which only reside in the atmosphere for a short period, before being broken down (to non-GHGs or other GHGs).
Change #4 – include Hydrogen as a greenhouse gas
The UK government has just published data [25] that shows that Hydrogen has a GWP20 of 32.2, which has very significant implications if Hydrogen is to become as large a part of the energy systems as estimated in some quarters. The GWP100 figure is 10.8, but as I have indicated above, we should move to GWP20 for a variety of reasons.
The global warming effect of Hydrogen is indirect – on its own it does not absorb infrared radiation like CO2 and so is not a greenhouse gas per se but it does affect global warming through it chemical reactivity in the upper levels of the atmosphere. The first and largest (40%) indirect effect is due to the Hydrogen combining with Hydroxyl radicals in the troposphere which leads to slower breakdown of Methane, CH4. Since methane is a greenhouse gas, the addition of Hydrogen to the troposphere increase warming. This reaction also increases the concentration of water in the stratosphere, which is also a greenhouse gas which causes 30% of the indirect warming due to Hydrogen. Finally, about 30% of the warming is because of the effect that Hydrogen has on ozone concentration in the troposphere.
In the latest IPCC GWP data the indirect effects of greenhouse gasses are taken into account (one reason why the GWP100 of methane rose from 23 to 25 between AR3 and AR4 [26]). So, there is no issue in principle with accounting for these indirect effects of Hydrogen. However, there is considerable uncertainty around the precise value due to uncertainties about the rate of soil sequestration of Hydrogen and other factors.
The lifetime of Hydrogen is in the order of 2 years. Despite this very short duration, according to the paper’s authors, the GWP20 is valid because:
Unlike previous methods, our new approach considers the lifetime of the pulse gas in addition to the lifetimes of the radiatively active gases causing the indirect forcing. This allows GWPs arising from indirect forcings to be calculated for gases with intermediate and longer lifetimes, such as hydrogen
So given these data, we need to decide if Hydrogen-caused warming will significant enough to add this gas to the list of gases tracked in organization’s inventories. The study above concluded
in this global scenario the increase in equivalent CO2 emissions based on 1% and 10% H2 leakage rate offsets approximately 0.4 and 4% of the total equivalent CO2 emission reductions respectively
in other words, for each one percent of the Hydrogen used in the economy that leaks, the beneficial effect of the emissions reductions will decrease by 0.4%. Bear in mind that these are the warming effects of the Hydrogen that has leaked – separately there are many more emissions associated with some methods used to manufacture Hydrogen.
A second study [27] looked at the likely leakage of Hydrogen in the UK and estimated that Hydrogen leakage in their central scenario, with 99% confidence levels, is likely to be in the order of 1.5% and total emissions of 174 ktH2 a year which, using a GWP of 32 would result in an additional 5.5 Million tCO2e emissions which is 1.3% of total UK 2020 emissions [28]. A note of caution about the leakage analysis in the study – apart from the assumptions on the extent of Hydrogen uptake – is the expectation that a lot of quick fixes on leakage will be implemented, which remains to be seen.
The UK governments proposed Low Carbon Hydrogen Standard methodology [29] explicitly states that
Work is still ongoing to narrow uncertainties for both the GWP impact and leakage rates from hydrogen production, but we expect GWP to be included to the emissions calculation in future.
As an aside, this Low Carbon Hydrogen Standard uses GWP100s to calculate the emissions intensity of Hydrogen. For consistency with the proposals set out here, it would be advisable that the Standard is updated so that Hydrogen producers provide an emissions intensity on a GWP20 and a GWP100 basis. Given that a large quantity of the emissions likely from grey and blue Hydrogen manufacture are due to Methane leakage GWP20 is certainly more appropriate.
Despite the uncertainties around the precise GWP20 of Hydrogen, there is a very strong case for including this gas in the list of gases to be reported in emissions inventories. I would not expect Hydrogen to be treated as a core GHG (CO2, CH4, N2O) but rather like a HFC where a single kgCO2e factor per kgH2 leaked to atmosphere, is employed. We would of course, have to get the IPCC or some other relevant body to provide the appropriate factor.
In conclusion
The four changes I am proposing are:
- extend Scope 2 to include all energy carriers such as Hydrogen, in order to avoid emissions ‘leakage’ to Scope 3
- introduce additionality rules around market-based reporting of Scope 2 emissions
- use GWP20 emissions factors instead of GWP100
- include Hydrogen as a greenhouse gas
The last major revision of the GHG Protocol was in 2015 and a lot has happened in the decarbonization space. I am sure that there are other changes that are equally impactful, so the time is right to amend the Protocol.
I would very much welcome thoughts, feedback and comment on these subjects. If you think the case is strong, please, please, please share this article and help develop some momentum around its implementation.
Edits: Please note that this article has been edited to correct some formatting and spelling errors. A final paragraph was added to Change #1, referencing the option to move Scope 2 Category 3a into Scope 2. Recommendation for Change #4 was added on 07-Sept-2022.
References
[1] https://ghgprotocol.org/corporate-standard
[2] https://www.gov.uk/government/collections/government-conversion-factors-for-company-reporting
[4] https://www.peelports.com/sustainability/net-zero-2040
[5] https://www.frompollutiontosolution.org/hydrogen-from-smr-and-ccs
[6] https://energy-cities.eu/50-shades-of-grey-and-blue-and-green-hydrogen/
[7] https://s1.q4cdn.com/695946674/files/doc_downloads/esg/PG_CTAP.pdf
[9] https://sciencebasedtargets.org/blog/addressing-the-challenges-of-scope-2-emissions-reporting
[12] https://www.nature.com/articles/s41558-022-01379-5#Tab1
[14] https://www.linkedin.com/pulse/research-supports-negative-effect-green-electricity-tariffs-enright/
[15] https://s1.q4cdn.com/695946674/files/doc_downloads/esg/2021/Procter-Gamble-Climate-CDP-repsonse.pdf
[16] https://www.tescoplc.com/media/476285/renewable-electricity-transition-roadmap-march-2019.pdf
[18] https://www.epa.gov/ghgemissions/overview-greenhouse-gases
[19] https://www.greenpeace.org/usa/fighting-climate-chaos/issues/natural-gas/
[20] https://news.stanford.edu/2021/08/09/better-way-track-methane-skies/
[21] https://www.edf.org/blog/2022/05/16/reducing-methane-will-help-hit-brakes-runaway-global-warming
[22] https://www.cisl.cam.ac.uk/files/methane_markets_and_food_cisl_working_paper_v3.pdf
[23] https://crsreports.congress.gov/product/pdf/R/R47206
[24] https://www.linkedin.com/pulse/what-gwp-friend-foe-niall-enright/
[26] https://archive.ipcc.ch/publications_and_data/ar4/wg1/en/ch2s2-10-3.html

0 Comments