
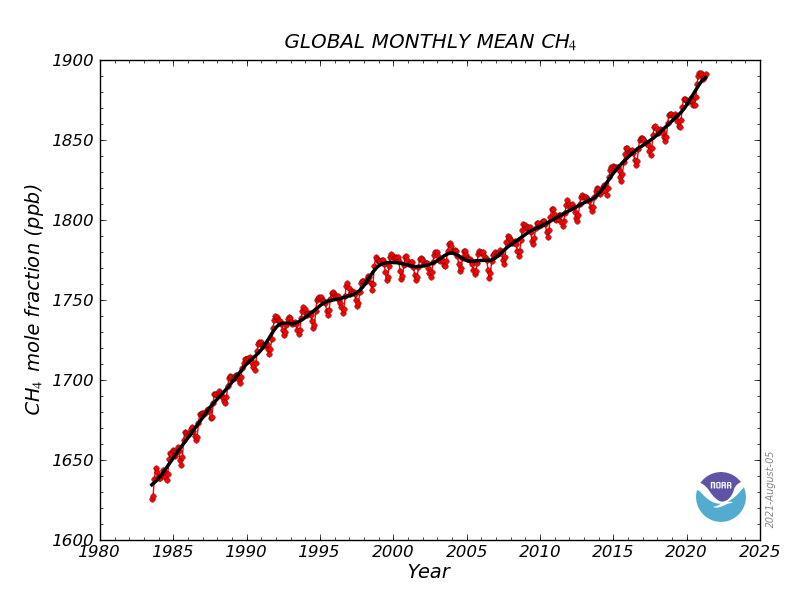
Quantifying the effect of greenhouse gases (GHGs) on global warming, such as methane helps us to understand where we can best focus our efforts to combat climate change. Here I will be discussing the strengths and weaknesses of the way we measure greenhouse gas impacts for the second most significant gas, methane – whose inexorable rise is shown left.
There are well over 100 different GHGs, each having a varying warming effects – that is to say they absorb infrared light to different extents and in different parts of the electromagnetic spectrum. The lifetime of these gases in the atmosphere differs a lot: some like methane, CH4, are broken down by chemical processes in a relatively short time, around 12 years, and others like sulfur hexafluoride, SF6, are very long-lived, taking in the order of 3,200 years to be eliminated.
For carbon dioxide, CO2, there are a number of different ways that it is removed from the atmosphere, some relatively fast like dissolution in sea water over 30-80 years, and some very slow, such as weathering reactions with rocks over hundreds or thousands of years, so precisely pinning down its lifetime is still to be done. As a result CO2 is generally assumed to have a lifetime of at least a hundred years.
A further complication is that some of the breakdown products of these gases may be GHGs in their own right, for example, methane eventually breaks down into long-lifetime carbon dioxide (through a series of intermediate chemical processes primarily involving radical chemistry in the stratosphere) and water, with a very short lifetime, meaning that even after it has decayed, methane has a residual warming effect with variable persistence.
To simplify the process of calculating the combined effects of lots of different emissions, we have created a measure called the Global Warming Potential, GWP, for each of the greenhouse gases.
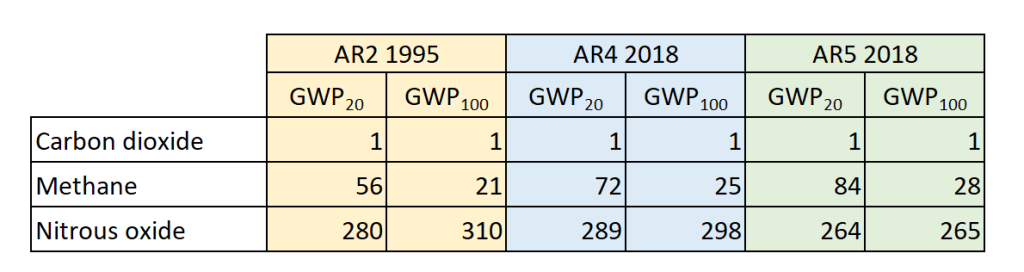
These GWP figures make it easy to calculate the combined impact of many different GHGs within an inventory. To do so, you simply multiply the quantity of each GHG by its GWP figure to get to a CO2 equivalent (the unit of mass of the GHG will determine the unit of the CO2 equivalent e.g. GtCO2e, MtCO2e, tCO2e, kgCO2e). So, if I emit 1 tonne of methane to the atmosphere that is the equivalent of emitting 28 tonnes of CO2 (using GWP100). Having converted all my GHGs into their CO2 equivalents I simply add these figures together to get to the total impact.
The calculation of the tonnes of CO2 equivalence is extremely important. At an international level treaties such as the Paris Accord or the Kigali Amendment to the Montreal Protocol require that decarbonisation is measured as percentage reductions in tCO2e. At an organization level, the the reporting standard, the GHG Protocol [1] insists that organizations use GWP100 to calculate their climate change impact. It is important to note that the 100-year GWP is not a requirement of the IPCC and the 5th assessment report said:
“There is no scientific argument for selecting 100 years compared with other choices. The choice of time horizon is a value judgement since it depends on the relative weight assigned to effects at different times.”
In other words the metric selected should depend on the time-horizon of the analysis. Given that a lot of planning is taking place around achieving NetZero emissions by 2050 or earlier, there would appear to be an argument for GWP20 to be more widely adopted, especially where decarbonisation plans are being developed at an organizational, city, sectoral and national level.
Methane First?
So lets dig a little deeper into the practical application of GWP. The thing that started me off on this subject was a discussion on LinkedIn around the proposition that we should focus on reducing methane, CH4, rather than CO2 since methane has a very high short-term impact on global warming compared to CO2 – as seen by its GWP20 of 84 compared to a GWP100 of 28.
Not wanting to jump to an immediate conclusion on whether accelerated action on methane makes sense, I did a quick calculation to see for myself how using a different GWP timeframe could affect how we prioritise emissions reduction at a national level.
I took the overall emissions of the USA from the Environmental Protection Agency (EPA) website [2] as my starting point, reproduced in the chart on the left, using the GWP100 factors, from which, given the total emissions, I could easily calculate the mass of the gases. I then applied the GWP20 factors to those masses, to arrive at the chart on the right.
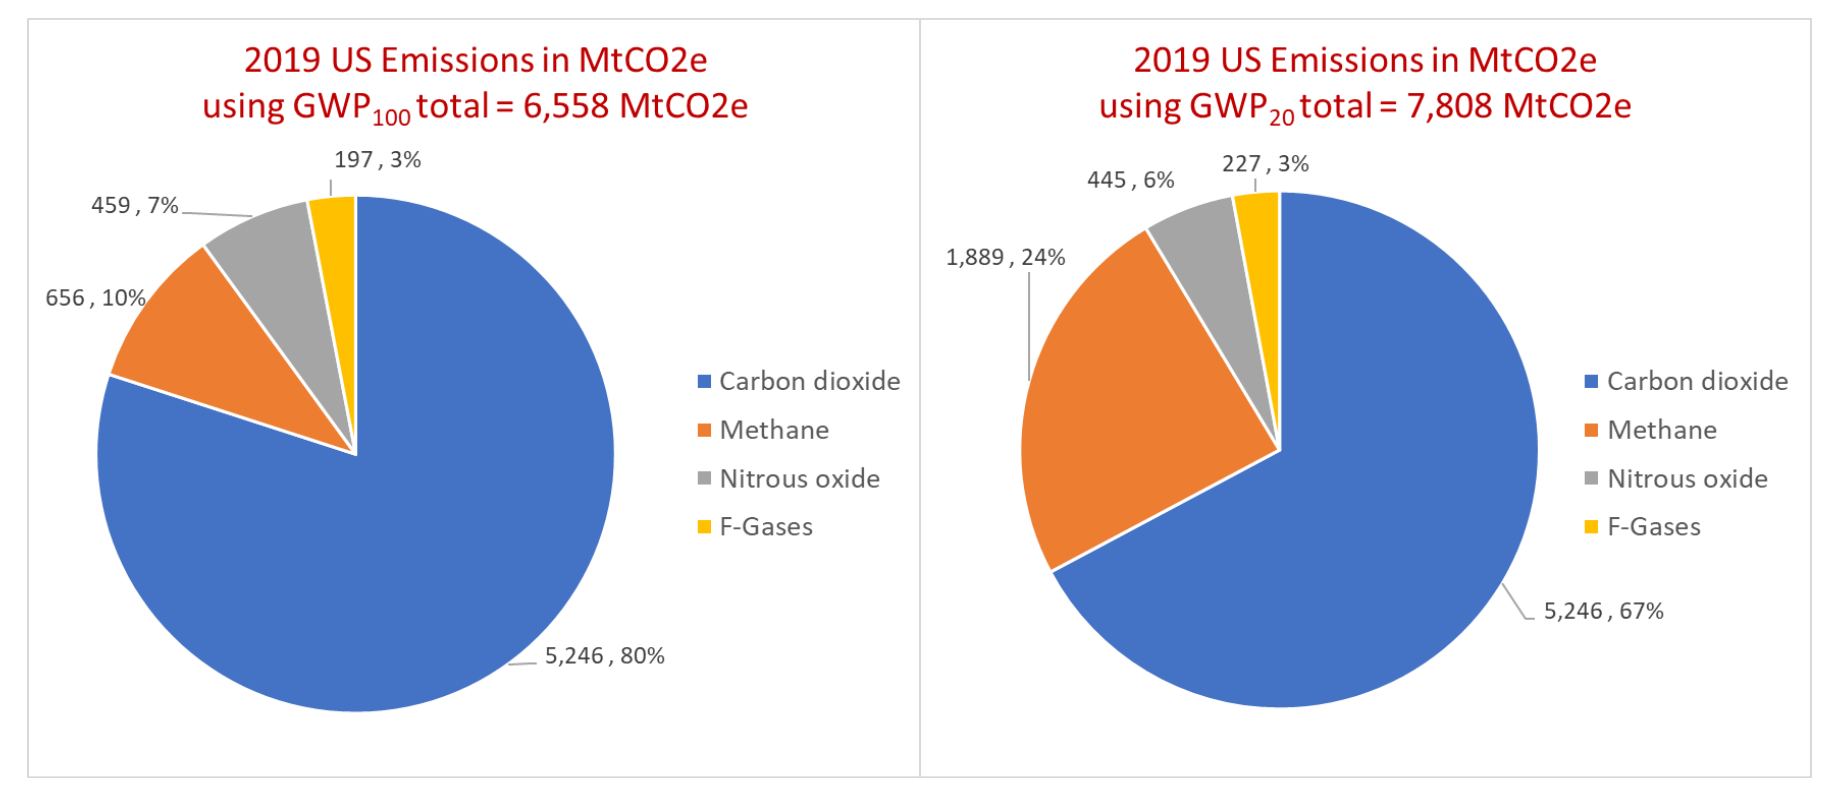
Now there is quite an amazing difference in respect of methane. It goes from being just 10% of the US’s total emissions to almost 25%, reflecting the difference between the GWP100 of 24 and the GWP20 of 72 (the EPA uses the AR4 factors so I stuck with these for this exercise – if we had used the AR5 factors the difference would have been larger still).
We should also note that using a GWP20 figure, the US total emissions have increased from 6,558 MtCO2e to 7,808 MtCO2e an increase of 19% due to the greater CO2 equivalence of methane. By the way, I didn’t adjust the F-gas calculations but these would have been a slightly larger proportion in the second scenario, but wouldn’t have affected the huge change in emphasis around methane.
In the US is a lot of pressure [3] from environmental NGOs and scientists for the EPA to use GWP20 to instead of GWP100, because this more realistically measures the impact of short-lived emissions sources like methane. Using the 100-year GWP, “falsely dilutes the impact of methane emissions, and undermines the urgency of taking the steps necessary to avoid climate catastrophe”. Indeed, there is some debate that the EPA figures may also be underestimating [4] the mass of methane emitted by as much as half. Finally, we should also remember that methane has a lifetime of 12 years, so even a GWP20 of 84 x CO2 is is lower than its true impact while it is in the atmosphere which probably closer that 120x that of CO2.
Having done these calculations, my view on the LinkedIn discussion was pretty straightforward “yes we should favour methane reduction efforts more than we are currently doing”. It seems obvious to me: we need to do everything we can to keep temperature rises to below 1.5 °C which we may well reach in the next 15 or so years, so focusing on emissions based on their short term impact makes absolute sense. Obvious really!
Or so I thought!
GWP* offers new insight into methane emissions.
One chap replied to my post, which included some of these GWP factors, and said that the correct measure for the GWP of methane is GWP*, which I had never heard of. This fellow was a farmer and he was particularly keen to get my view on the use of GWP* for biogenic methane (that is to say from cow belches and suchlike). Intrigued by this, I researched what GWP* is and I am pleased to share what I discovered with you via this article.
There are two aspects of methane that make its global warming effect quite unlike that of CO2. First is its short lifetime and secondly is the fact that it’s decay process (or sink) isn’t limited. That means that methane and CO2 have very different warming effects
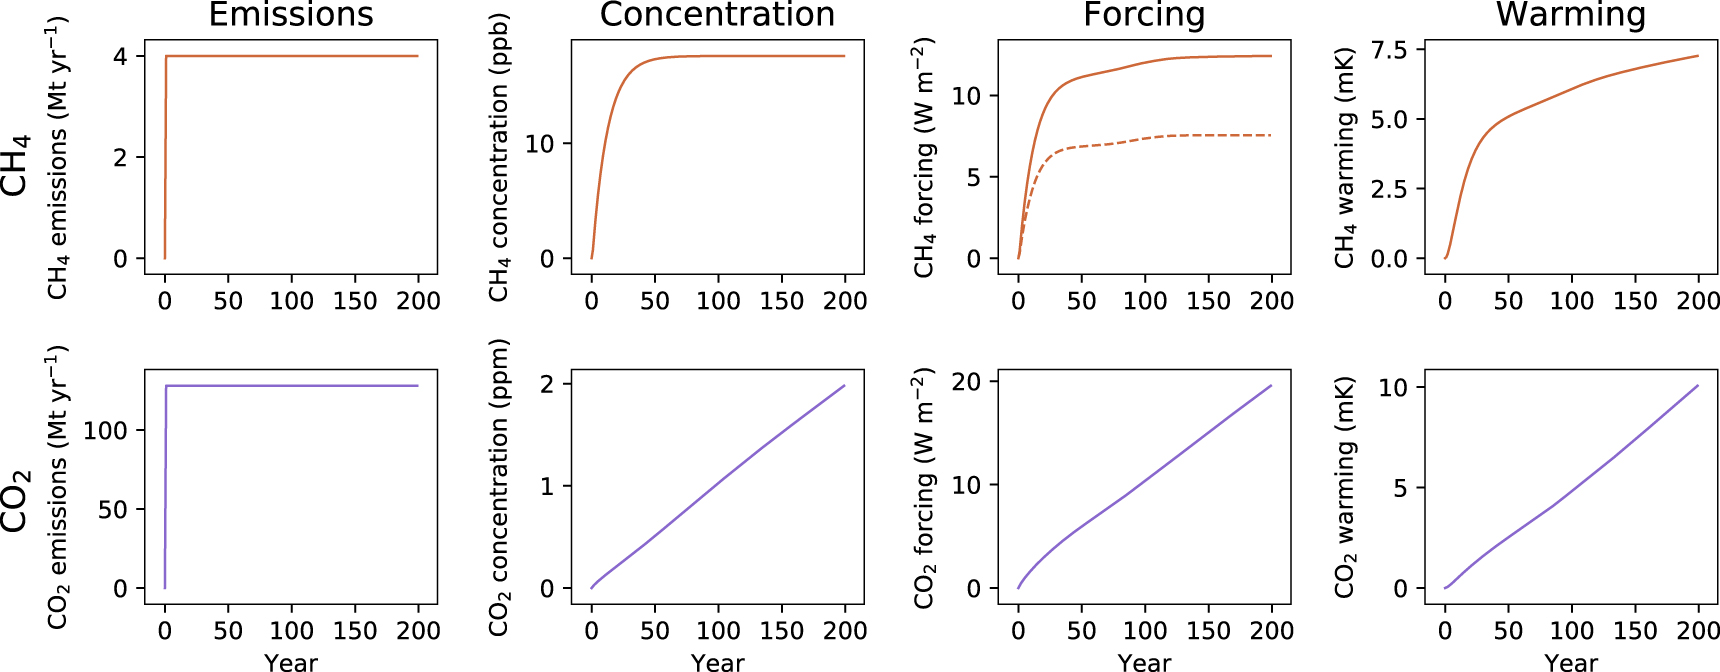
The charts above are taken from an Institute of Physics paper [5] exploring the use of GWP*. It is an excellent read and open source too. Looking at the left-most top chart we can imagine an emission of 4 Mt a year starting in year 0 and continuing for 200 years. To put it into context, this 4 Mt year-1 is close to the average UK methane emissions between 1990 and 2016. Below that, in purple, is an emission of 128 Mt a year of CO2, using an even more up to date methane GWP100 factor of 32, so it is intended to have the same warming effect, according to the GWP approach.
However if we turn to the second chart we can see that the concentration of the methane in the atmosphere reaches a steady state after around 12 years – that is because the amount of methane decaying at the end of its lifetime will at that point match the amount being added each year. This is quite unlike the concentration of CO2 which keeps on rising in the chart below.
As a consequence the amount of heat the methane traps, shown in the third chart labelled “Forcing”, also reaches a plateau shown by the dotted line, unlike the case for CO2 where the heat trapping increases linearly. However the methane does break down into CO2, so there is a second solid line which illustrates the total warming resulting from the methane and CO2.
Its probably useful to make a small digression here on the breakdown of methane into CO2. A simplified breakdown formula for the oxidation of methane (whether combustion is in a gas boiler or the eventual breakdown in the stratosphere) is:
CH4 + 2O2 → CO2 + 2H2O
One could be forgiven for thinking that oxidizing a kilo of methane produces a kilo of CO2, but that is not the case. When I burn a kilo of methane the product is actually 2.4 kilos of carbon dioxide because the molar mass of each is different. The molar mass of methane CH4 is 16 kg mol-1 ( 12 kg mol-1 for the Carbon and 1 kg mol-1 for each Hydrogen), whereas for CO2 it is 44 kg mol-1 (12 kg mol-1 for the Carbon and 16 for each Oxygen). Note that I have used rounded molar masses – the atomic weight of hydrogen is actually 1.008 and similarly for the other elements quoted here.
Remember that GWP reflects the emissions of a constant mass of gas. In GWP terms the oxidation of a kg of methane with a GWP100 AR5 of 28 produces 2.4 kg of CO2 whose total GWP100 AR5 is 2.4.
When we convert these effects into warming, in the final pair of charts on the right hand side, we can see that the total warming after 200 years by methane reaches 7.5 mK and for CO2 it reaches 10 mK. By the way, I noticed on this chart that the CO2 figure for 100 years warming is under 5 mK whereas for methane it is over 5 mK, suggesting the GWP100 of 32 used in the paper, still understates the impact of methane relative to CO2.
I had to revisit these charts several time because they produce a real head-scratching moment. The methane charts are essentially saying that: adding methane to the atmosphere at a steady rate has no real effect on warming once that methane has reached its peak concentration. Wow!
There will be an ongoing increase in the overall warming effect because the CO2 produced by the decay of methane is in itself a GHG, but the large ongoing warming effect of the methane remains constant since the mass of methane is constant with the same amount decaying each year as is added.
From the charts above it is clear that there are some weaknesses in GWP100 as a metric for the warming effect of a GHG. The concept underlying GWP100 is that the 128 Mt per year of CO2 release is equivalent to the 4 Mt per year of methane. The reality is quite different and after the first 12 years, once the methane has reached it saturation level, that difference becomes very pronounced. The year 13 methane release, in simple terms, does not increase warming, unlike the year 1 emissions, since the 4 Mt of methane emitted in year 13 will be balanced by the decay of the 4 Mt of methane emitted in Year 1, resulting in no net methane addition to the atmosphere.
The solution, say the authors, is to modify the GWP metric so that it is sensitive to the fact that as well as additions of a GHG to the atmosphere, removals will also be taking place so the net effect is different. This new metric is called GWP*, and can be derived from exisisting GWP metrics using the formula below:
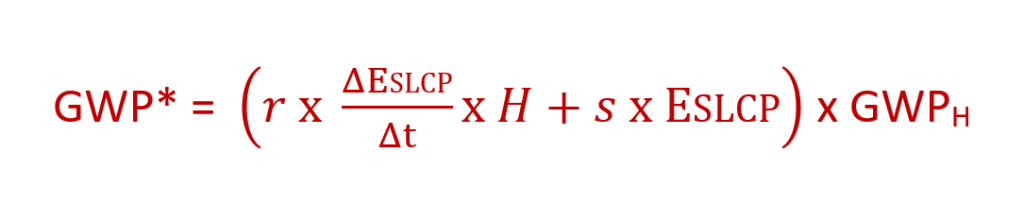
This formula has two components. The first is the ΔESLCP / Δt which is the rate of change part, which is meant to reflect the net removals or additions of the short-lived climate pollutant. The second part is the current level of emissions of the SLCP ESLCP. There are two constants r and s which act as weighting values between the components.
Using a process of trial and error, comparing the outputs of the GWP* formula with the calculated warming effects of methane, the authors were able to arrive at a further simplification of the formula, where there are two just two emissions inputs, ESLCP(t) which is the current rate of emissions and ESLCP(t-20) which is the rate of emissions 20 years ago.

The first component, 4 x ESLCP(t) gives a very high weighting to the current methane emissions, making them 4 times higher than the GWP100 figure, but the second element -3.5 x ESLCP(t-20) negates that initial weighting to a large extent, if the rate of emissions is the same, leaving a small residual which reflects the indirect emissions due to the CO2 from the breakdown of the methane.
The authors the illustrate a scenario where the methane emissions start off at that same 4 mt per year figure for 50 years but this then declines to 0 over the next 50 years, as shown in chart A) below.
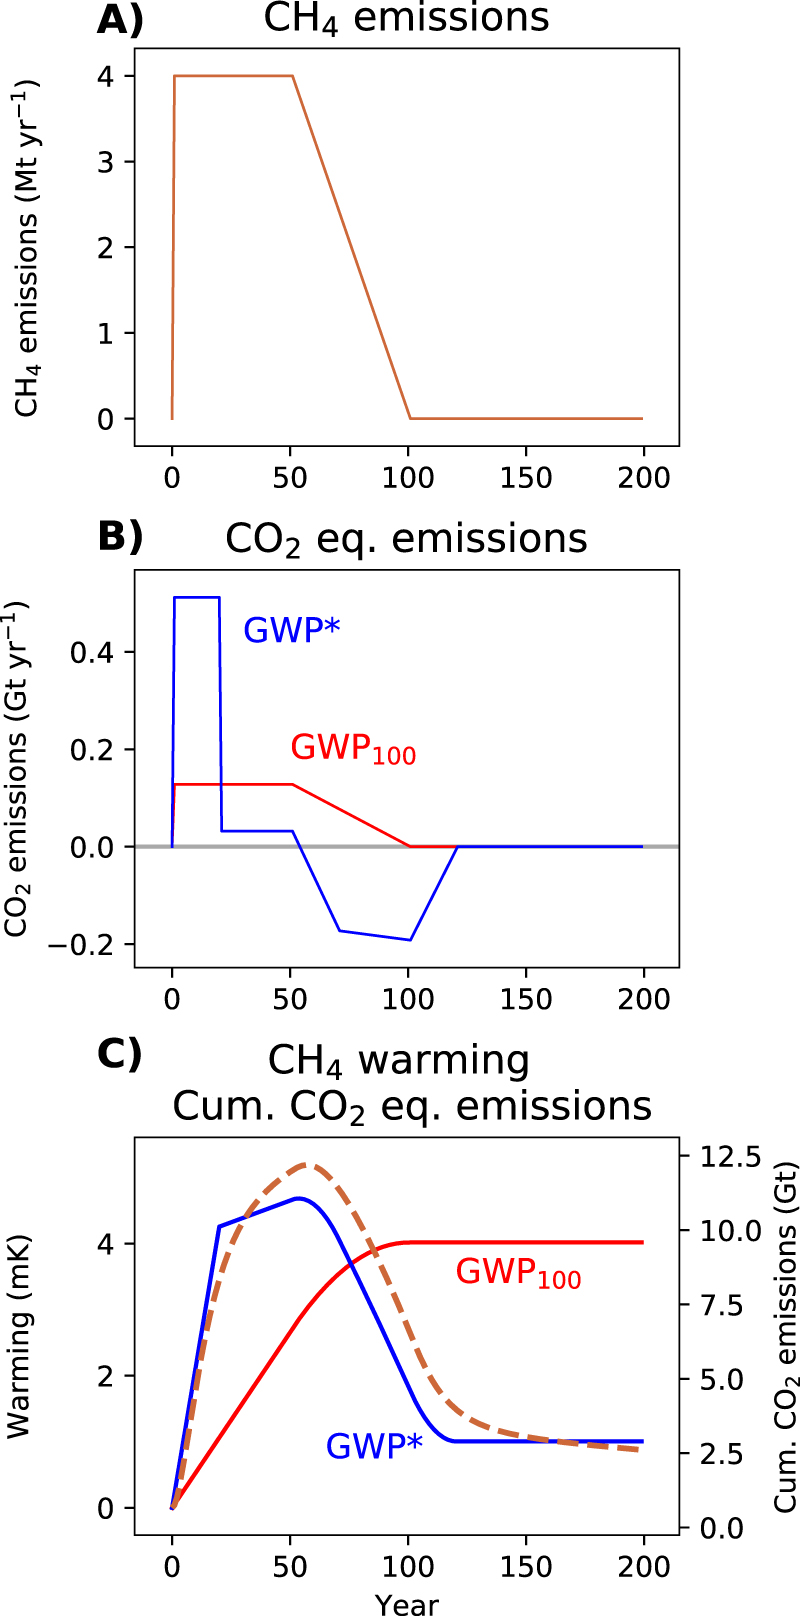
The next chart then shows how the GWP100 and GWP* values change. The GWP100 factor in red is 0.128 GtCO2 equivalent per year in the first 50 years (the same as the 128 Mt per year in the earlier calculation, only this time we have Gt being charted not Mt). After year 50 the GWP100 value raamps down to zero as the methane emissions decrease.
The GWP* figure on the other hand, in blue, calculated using the second formula above, starts out as 4 x the GWP100 figure, i.e. 4 x 0.128 = 0.512 GtCO2e for the first 20 years, However in year 20, we now subtract -3.5 x the historic emissions so the overall value for GWP* is 0.5 * 0.128 GtCO2e = 0.064 GtCO2e per year. Once the methane emissions start to decline from year 50 to year 100, the GWP* turns from positive to negative because the – 3.5 x historic emissions component becomes larger than the 4 x current emissions component. From 100 to 120 years the negative component due to the historical emissions is acting alone, but at a declining rate so the blue line trends upwards until finally after 120 years GWP* becomes zero.
The third chart at the bottom shows the cumulative value for the GWP100 and the GWP* values (again in red and blue respectively) along with the computed real warming effect in orange. The intention is to demonstrate just how well the GWP* can approximate the real world warming effect of the methane emissions (or conversely, how poorly the GWP100 does).
The authors are completely open to the fact that the size of the s and r constants and the selection of the 20-year prior data were achieved by trial and error to achieve the best possible fit with the real-world warming rather than being derived from underlying chemical or other physical processes. What is clear from the lower chart is just how good the GWP* approach is at cumulatively modelling warming effects.
Implications, pros and cons.
Working regularly as I do, with emissions inventories and targets, I cannot overstate just what a big change GWP* is and what enormous policy implications this would have if it were to be adopted. Indeed the authors go on to say that the methodology is entirely compatible with reporting under the UN Framework Conventions on Climate Change (UNFCCC) such as within the Paris Agreement process to calculate the National Determined Contributions of countries submitting their target to the UN and point out that for many possible applications of GWP* the 20-year historic emissions data is readilly available and recorded in a priorly verified form.
The paper shows that the GWP* methodology is very much better at showing the real-world effect of changes of emissions for one SLCP, methane. A key fact is that reducing methane emissions at a rate of greater than 3% per annum compared with the level 20 years prior will lead to a negative GWP*. They argue that rather than treating current methane emissions as a positive contributor to climate change, what actually matters is whether the concentration in the atmosphere falls so there is, in practice, a cooling effect from that reduced level of emissions as the decay of the prior emissions is greater than the current additions. If the the overall forcing effect from methane declines because of the relationship between current and historic emissions, then that should be signalled by the GWP metric so that folks can see that when formulating policies. I would disagree with the authors on the naming, instead of labelling that declining concentration as a effect a cooling effect, I would much rather call it a reduced heating effect since that is what it really is.
In practice, if we adopt GWP*, we could see organisations with large historic methane emissions which are nevertheless decreasing, being able to claim negative total CO2e emissions. One sector that this applies to is Oil and Gas companies.In other words:
If in the year 2001 an Oil and Gas company’s fugitive losses of methane were much higher than today, then the company would be able to report that they have negative overall emissions expressed in tCO2e equivalents, despite the fact that they are still emitting methane from their operations. Alternatively if they have other emissions from other GHGs like CO2 the total would appear to be much lower because of the effect of the negative methane factor.
That doesn’t seem right to me, somehow, especially if we move to a world of carbon taxation where organisations make payments related to their overall emissions. It would be wrong for the Oil and Gas companies to receive windfall payments or be able to portray themselves as “heroes” in the fight against climate change simply because they are less bad today than they were 20 years ago.
This is a typical problem associated with grandfathering where environmental performance is considered against a baseline of historic pollution rather than as an absolute value. For example, in the early years of the EU-emissions trading system, big polluters were free-allocated emissions permits related to the level of emissions that they were producing. Indeed there was a scandal around the fact that many of the polluters in the electricity generation sector were overallocated permits which they could then sell, not only making windfall profits they did not deserve, but also undermining the objectives of the trading scheme by flooding the market with cheap permits which allowed other emitters to defer action. Grrrrr.
Another example around grandfathering would involve a farmer reporting using GWP*. If their cattle herd had been around for 20 or more years then they would be reporting very few emissions, whereas a new cattle farmer would report very high emissions in the first 20 years simply because they have no prior emissions to subtract. That somehow doesn’t seem right either.
Thankfully some of the key decision-makers are wise to the perverse effects that reporting using GWP* could have. The UK Committee on climate change report “Land use: policies for a NetZero UK” [6] states:
“A new usage of the GWP100 metric (named GWP*) has recently been developed to recognise the difference in how sustained emissions of methane and CO2/N2O affect global average surface temperature, which is not fully captured by the current metric….”
“Reducing biogenic methane emissions from UK agriculture will have unambiguous benefits for the global climate. Given the economy-wide net-zero GHG emissions target, official accounting in the agricultural sector should continue to use the GWP100 metric required for consistency with national and international frameworks.“
And I have to say I thoroughly agree with them. Even if stable methane emissions do not increase climate change much (except through the breakdown CO2 produced), that does not mean that we should accept these emissions and the temperature rise that they have produced. Using GWP* could disincentivise action on methane because the low or negative GWP values would not appear to merit action, whereas, in the case of methane, we are in the unique position that we can reverse historical climate change ie. “diminishing historic heating effects” as I described it earlier.
I would also be extremely wary that the folks at the Greenhouse Gas Protocol don’t allow GWP* in a repeat of their previous disastrous market-based reporting rule-change, which unleashed a wave of “greenwashing” as organisations falsely reported zero emissions from non-additional green electricity tarrifs – something I have vented my spleen on on many occasions [7].
There was some discussion that the IPCC would recommend the use of GWP*, but thankfully they have decided not to make any formal decisions on this.
As pointed out in AR5, ultimately, it is a matter for policymakers to decide which emission metric is most applicable to their needs. This Report does not recommend the use of any specific emission metric as the most appropriate metric depends on the policy goal and context (see Chapter 7, Section 7.6). A detailed assessment of GHG metrics to support climate change mitigation and associated policy contexts is provided in the WGIII contribution to the AR6.
I will, of course, look out for what the Working Group III report Mitigation of Climate Change has to say about GWP* and their thoughts on “methods for reducing greenhouse gas emissions, and removing greenhouse gases from the atmosphere”, and will report back in a future article, no doubt.
I should point out that this issue of the inadequacy of GWP100 to properly account for the impact of methane has been understood for some time and over the last decade or so a range of alternative measures have been proposed, which are well summarized in a paper [8] by Paul Balcombe and colleagues. This paper recommended that:
“Short-term emissions estimates of facilities or regions should be transparent and use a single metric and include the separated contribution from each GHG. Multi-year technology assessments should use both short and long term static metrics (e.g. GWP) to test robustness of results. Longer term energy assessments or decarbonisation pathways must use both short and long-term metrics and where this has a large impact on results, climate models should be incorporated.”
Conclusions
First of all I should point out that the whole debate around GWP* is related to methane. There are lots of other short-lived greenhouse gasses but methane is far and away the most dominant. Furthermore there isn’t yet a sufficiently large body of academic work to show if the GWP* calculation, with its arbitrary s and r factors and 20-year prior choice are applicable to those other gases. So in short if methane isn’t relevant to you then you can ignore this metric.
If on, on the other hand, you do have methane emissions then you should consider GWP* as a tool to better understand the impact that reducing those emissions can have – it should emphasize that rapid reduction of your methane emissions can actually reverse some of the climate impacts you are having (just don’t use the word cooling, instead say “reduced heating”).
For example if you have a science-based target, and methane is a significant part of your emissions, it may make sense to revisited the target using the GWP* methodology to better understand the timeframes over which methane reduction are likely, the relative impact of your efforts on methane compared to efforts on reducing other long-lived greenhouse gases, and the benefits of changing your focus on one or other category of gases.
One area that would merit further investigation and academic work is on GWP* and refrigerants and industrial HFCs and other gases, which represent 2-3% of the global total GHG effect. Amongst these refrigerants and other gases are some extremely short-lived one while others are very long-lived. It would be interesting to see if, in the context of the Kigali Amendment to the Montreal Protocol whether there is a more nuanced “merit order” in terms of the phase-down of HFCs based on their current and historic rates of emissions and the real effect that changes will have on warming.
I would also urge fellow professionals to be on the lookout for efforts to use GWP* to “game” reporting of emissions. It could, for example, be very attractive to some in the Oil and Gas industry to portray themselves as offering very large negative global warming impacts.
As ever – delighted to exchange with further views on this subject.
[1] https://www.ghgprotocol.org/sites/default/files/ghgp/Global-Warming-Potential-Values%20%28Feb%2016%202016%29_1.pdf
[2] https://www.epa.gov/ghgemissions/overview-greenhouse-gases#colorbox-hidden
[3] https://www.greenpeace.org/usa/ending-the-climate-crisis/issues/natural-gas/
[4] https://news.stanford.edu/2021/08/09/better-way-track-methane-skies/
[5] Demonstrating GWP*: a means of reporting warming-equivalent emissions that captures the contrasting impacts of short- and long-lived climate pollutants. John Lynch, Michelle Cain, Raymond Pierrehumbert and Myles Allen, Environmental Research Letters, Volume 15, Number 4. https://iopscience.iop.org/article/10.1088/1748-9326/ab6d7e
[6] www.theccc.org.uk/publication/land-use-policies-for-a-net-zero-uk/
[7] https://www.linkedin.com/pulse/why-buying-renewable-electricity-backward-step-niall-enright/
[8] https://pubs.rsc.org/en/content/articlehtml/2018/em/c8em00414e

0 Comments