

Those of you who have followed my previous articles on LinkedIn will know that I have a particular bugbear about Green Electricity tariffs.
I have three fundamental objections to these tariffs:
1. The tariffs are based on a lie. The renewable electricity has been produced as a result of the subsidy paid for by all electricity consumers not from any contribution made by the organisations or individuals falsely claiming it for themselves.
2. The use of these tariffs to report lower emissions leads to double-counting of emissions reductions. This is because the renewable generation is usually part of the mandatory target for utility companies and so form part of the UK-wide ‘location-based’ grid average CO2 conversion factors, but the same renewable electricity is used by the “green” tariffs consumers in their own ‘market-based’ calculations to claim zero emissions. As a result, the overall emissions recorded are lower than they actually are.
3. Most worryingly, is the possibility that that the Green Electricity tariffs disincentivise important efforts to reduce electricity use. After all, why invest additional time and money in the difficult work of energy efficiency if the emissions are already zero?
The latter concern has, until now, merely been a suspicion on my part, based on my own interactions with decision-makers in many organisations. Mindful that I could not find any research on this topic, I was delighted when my son, Connor Enright decided to look into this subject for his Natural Sciences Master’s thesis at the University of East Anglia – with the full support of his School and input of his thesis supervisors, of course.
The first thing that Connor needed was a large and authoritative dataset which included information on both the amount of “green” electricity organisations were using and their emissions reduction efforts. The source chosen was the CDP (previously known as the Carbon Disclosure Project) data which is regarded as the go-to resource for corporate emissions reporting. CDP submissions are often independently verified and the comprehensiveness of the response underpins an organisation’s CDP Climate Disclosure Score which some stakeholders consider material evidence of the organisation’s quality of governance or a measure of their management of risk.
The cost of the CDP data set was higher than the research allowance available to Master’s students so Connor had to seek additional partners within the UEA Schools for funding support and I also made a contribution to the costs of the data. Regardless of funding, the research was supervised by the University and based on the statistical methods described.
As mentioned above, there are two recognised methods of calculating emissions arising from electricity use. The methods vary in terms of the emissions conversion factors used (the kgCO2 per kWh of electricity). Under the longstanding ‘location-based’ method organisations would use the grid average conversion factors, calculated from the national or, sometimes, regional mix of generation technologies used to produce electricity.
Under the ‘market-based’ rules, each individual electricity supply that an organisation procures can have a different emissions factor, calculated from the generation mix of that supply, even though they fall under a common location for the location-based reporting.
In order to back up a lower than grid-average emissions factor for market-based calculations, the supplier needs to provide the buyer evidence that the electricity was generated from renewable sources. That is where the Electricity Attribute Certificates (EACs) come into play. These are certificates which attests that a certain number of MWh have been produced from zero emissions renewable sources. These certificates are called REGOs – Renewable Electricity Guarantees of Origin – in the UK, Guarantees of Origin in the EU and “green tags” or Renewable Electricity Certificates in the US. In fact, there are many such certificates around the world, allowing organisations to attest that the electricity that they are supplied with has a zero carbon emissions factor.
“Green electricity tariffs” are normal electricity supply contracts which happen to have attached to them the equivalent number of REGOS to enable the user to state that electricity supplied can be traced back to the same amount of generation from renewable or zero carbon sources. It is these EACs attached to the electricity that permits the buyer to apply a zero emissions factor when calculating the emissions for this particular tranche of electricity consumed.
Market-based reporting is not just based on EACs – for example an organisation which has its own ‘behind the wire’ solar PV generation could report this proportion of its electricity as zero-emission within a market-based total. Some EACs are used within Power Purchase Agreements where the cost of the energy includes the full, unsubsidized cost of the generation which addresses my first objection. There are other forms of EACs other than REGOs – any statement of the attributes (aka emissions) of a supply is an EAC. It should be noted that REGOS that were reported as being related to PPAs, were not included in the study. “Non-green” EACs used for internal accounting were included, however.
Furthermore, a few organisations actually report a market-based total which is higher than a location-based total because they have done the work to assess the actual fuel mix used in the electricity generation by their suppliers which may include more fossil fuels than average, resulting in an emissions factor that is higher than the location-based factor. Such organisations could be considered to be particularly diligent in their approach as they are being transparent in their emissions, using the market-based method even though it shows them to be above the national average.
Returning to the CDP data, the most important aspect in terms of this study is that, while the CDP allows organisations to report their headline emissions using either a location-based or market-based method, respondents are nevertheless required to provide the location-based equivalent as part of their submission. In the end, the study used a sub-set of organisations headquartered in the EU who reported in 2018 as the data source. Just one company was explicitly excluded because of apparent data input errors (“Dixon Carphone”), but a small number of extreme outliers (based on a statistic called the z-score of ±1.64 or 1 standard deviation) were also omitted in order to improve the confidence levels achievable in the statistical analysis. The resulting cleansed data comprised 400 company submissions, so the sample was sufficiently large to arrive at statistically significant conclusions.
The first “Explanatory Variable” in the analysis uses the difference between the market-based and location-based figures submitted by the company. This variable is called, EV1, the “Proportion of Market Based” emissions: a figure of 100% means that the organisation is reporting the same emissions under the location-based and market based methods, where a figure of 0% means that they are solely reporting zero emissions in the market-based method, 50% means that the market-based emissions are half the location-based emissions. The use of percentages means that the analysis is not skewed by larger electricity consuming organisations in the dataset.
Now it is possible that some of the organisations reporting zero emissions using the market based method are doing so because they have on-site renewable generation or a power-purchase agreement for renewable electricity generation which they have fully funded (i.e. which demonstrate additionality). In order to discern this effect, a second explanatory variable, EV2, was developed from the data which is the “Proportion of Scope 2 electricity certified by EACs”. We should bear in mind that these EACs could come in many flavours as many of the organisations reporting have operations outside the EU, so they will not just be the EU REGOs.
Given these two explanatory variables, the study was able to divide organisations into four distinct groups:
- Organisations that only report using the location-based method and do not report using any EACs. These organisations are called Uncertified Assurers in the study.
- Those organisations that report using the market-based method without reporting any tariff based EACs – i.e. those that do not use REGOS etc. from “green electricity tariffs” in their market-based reporting. These are the Uncertified Signallers.
- Then we have the organisations that keep a track of their EACs and report them under the CDP but do not use them to calculate market-based emissions. These are the Certified Assurers.
- Finally, we have the organisations who use EACs and report using the market-method, which are called Certified Signallers.
Having determined that organisations can be segmented into these groupings, the study then needed to consider the internal efforts made to reduce emissions, the response variable. This was taken from a number of fields in the CDP data where the organisation could report emissions reductions achieved over the annual reporting period. The entries used to calculate this variable were those where users reported emission reductions due to ‘process’, ‘energy efficiency’ or ‘other’ action if there is a specific mention of “efficiency”. Unlike the explanatory variables, the components of the response variable were already reported as a percentage reduction in total emissions, so that all organisations are treated equally.
So, what did the study find out about the levels of energy efficiency being achieved by the four groups above? The table below summarizes the mean efficiency savings made:
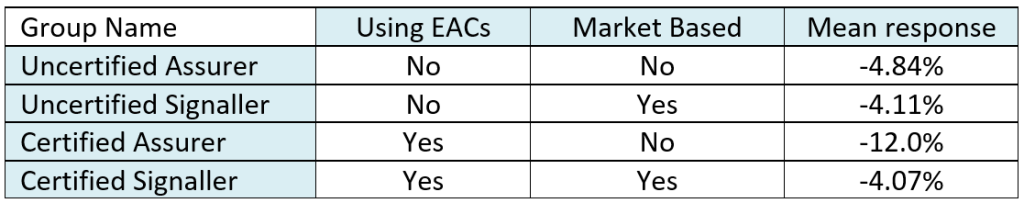
The stand-out finding from the table above is that the Certified Assurers, i.e. the group of organizations that tracked and reported their EAC use as part of their CDP disclosure but did not use market based reporting were also the group that delivered by far the largest emissions reductions.
I must admit that this was a revelation to me as I have been consistently anti-REGO without appreciating that some organisations were not using them as a “greenwashing” or cheap emissions reduction tool but rather were using them for internal accounting, assurance and risk management.
I asked Connor to summarize his findings which I have reproduced below in italics, with some of my own observations.
“The headline findings of the study can be summarized as follows:
1. EAC use alone does not alter the extent of corporate mitigation action. When reporting methodology is considered corporations disclosing EAC purchases via a location-based methodology (without utilising their zero-emissions factors), had significantly improved corporate energy efficiency responses (industry best practice). When considering the percentage reductions in emissions from market-based reporting, we see corporations with high market-based emissions savings conducting a lesser energy efficiency response. The utilisation of EACs is shown to strengthen this trade-off.”
In other words, REGOS themselves are not bad, it is their misrepresentative reporting though an imperfect market-based reporting method that is the problem. A key learning point for me.
2. “The balance between the external signalling and energy efficiency action is not determined by the utilisation of EACs alone however, but rather by factors including the position of a corporation in a market and the relative internal/external pressure put upon that corporation. EAC utilisation is higher in consumer-facing industries considering reputational risk, and lower in price-sensitive business-to-business sectors. EAC utilisation is significantly higher in RE100 corporations.”
The study found, not unexpectedly, that the more consumer facing industries are more likely to have a higher proportion of their scope to emissions certified with EACs.
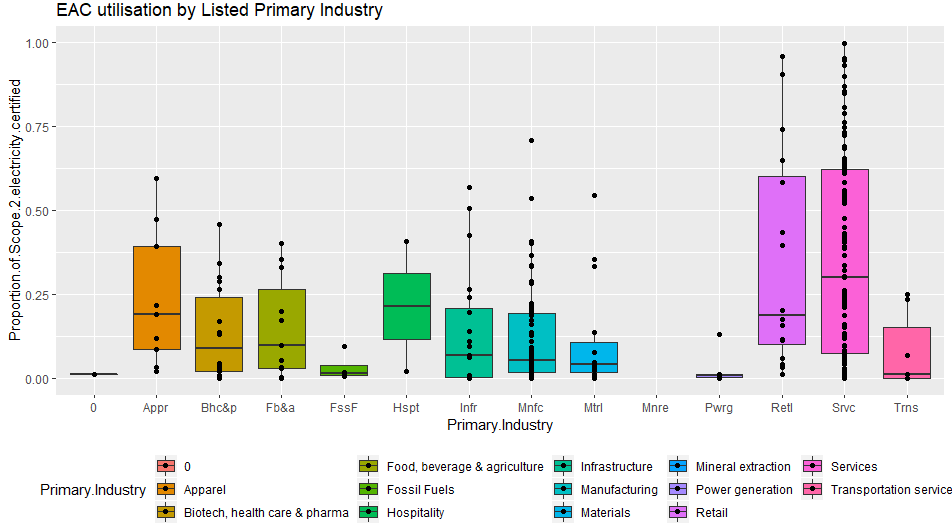
In my opinion this may reflect the fact that energy is a relatively low input cost for these sectors – meaning that they have fewer high return efficiency opportunities and they would be more attracted to the “quick fix” of green tariffs because their main customers, the public, are less likely to see the use of “green electricity” as an avoidance tactic.
3. “Evidence suggests EAC utilisation for signalling does alter the effectiveness of corporate mitigation action. Corporations using EACs had lower emissions savings from their reported initiatives, spending more on low carbon purchases, with these purchases making up a greater proportion of their mitigation initiatives. Corporations utilising EACs have less cost-effective mitigation action outside of their low carbon purchases, and these low carbon purchases provide significantly lower returns on investment. Overall EAC “signalling” corporations show no improvement to their return on investment despite the presence of the “Certified Assurers” amongst this group since they make up a relatively small proportion of the total.”
That is an interesting conclusion because it is often the case that emissions reductions make good business sense irrespective of the signalling benefits. Organisations that forgo mitigation by choosing the “easier” green tariff route are forgoing sources of value which deliver higher returns that the core business.
4. “EAC use is not connected to improved mitigation action or financial return, therefore only useful for green signalling. EAC use correlates with corporate reputational risk but drops where corporations report having increased costs of risk management, or valuable financial opportunities present.
The study concluded that two corporate groups show the two different paths of EACs use:
- The “Certified Signallers” could be viewed as embedding irresponsible principles in the CDP through their appropriating the “public commodity” of low-carbon attributes through EACs to be used in green signalling.
- The “Certified Assurers” excelled at both Stakeholder Engagement and Verification & Assurance. Here EACs support energy and emissions accounting, and through their use in parallel with location-based reporting, the transparency of mitigation action. This improves corporate responsiveness to legislative, reputational, and market risks alongside codifying excellent carbon disclosure practice.”
I started this blog with my concern that the Green Electricity tariffs disincentivise important efforts to reduce electricity use. I think I will have to modify this slightly to conclude that the Green Electricity tariffs, when used purely to signal lower emissions, disincentivise important efforts to reduce electricity use.
Some of the organisations focusing on green signalling could be forgiven for being unaware of the intricacies of additionality, double-counting and displacement. They may have been sold the notion that “green electricity” is a good thing and not appreciate that they have been sold a false deal. Nevertheless, the effect is the same, emissions are almost certainly higher than they would have been had they not taken that course of action – “the road to hell”, as they say, “is paved with good intentions”. Other organisations have been using EACs to signal virtue in full knowledge of the inaccuracy of this claim. This is unforgivable. I hope that one day these organisations, and the consultants helping them and the organisations selling them the EACs, will be called to account and shown up for the action-evaders that they truly are.
Further blame should also be apportioned to the institutions that deliver EAC schemes and reporting methodologies. EACs would be fine if their cost was sufficient to incentivise new generation. The failing here is due to very simple economics (mandated supply without mandated demand) or parallel subsidisation (successfully addressed by the Chinese EAC scheme, where renewable generation can use government support and will count towards regional targets OR can be certified and traded; not both). The simple rule should be “you cannot claim an emissions reduction that has already been claimed elsewhere” (as set out in the UK standard PAS 2050:2011) – in other words that same reduction cannot be packaged via EAC’s and sold on again so other participants can claim them in their reporting.
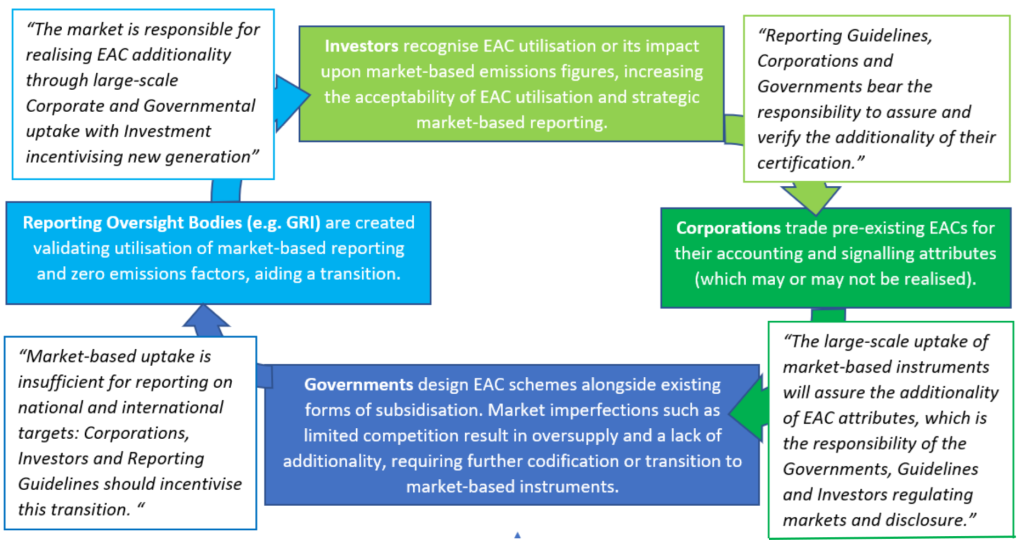
The thesis illustrates the interdependence of the participants in the EAC and how the “buck is passed” – my words – from one actor to another.
You can download a full copy of the thesis by following this link.

0 Comments