
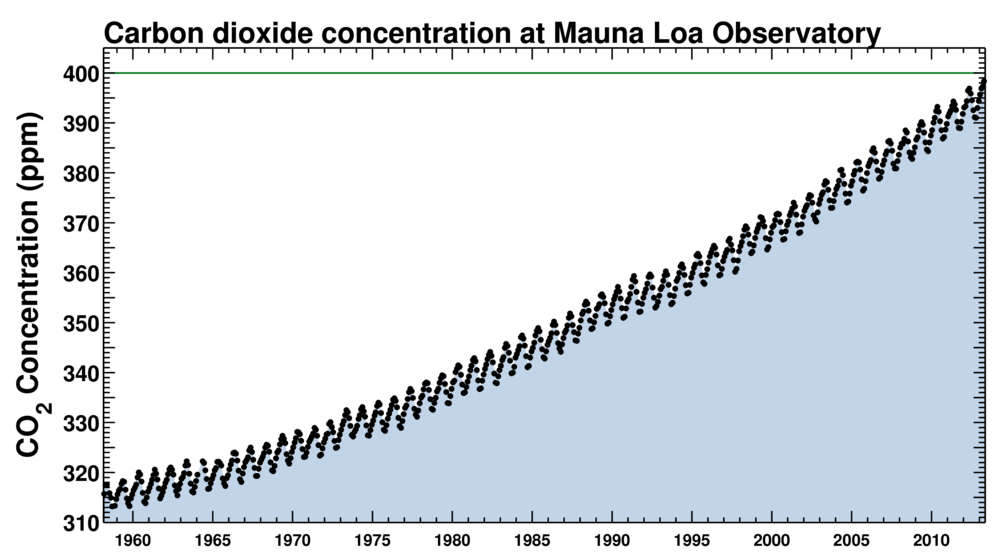
 The only measure of our progress on climate change with any integrity is the record of atmospheric concentration of CO2. None more so than the series of readings that have been taken in the middle of the Pacific Ocean at the Mauna Loa Observatory in Hawaii which have been taken uninterrupted since 1958. This is the Keeling Curve, named after Charles Keeling who initiated the measurements. On May the 9th these readings passed a milestone – they reached 400 parts per million for the first time.
The last time atmospheric CO2 was at this level was some 3M years ago in the Pliocene geologic era. At that time the temperatures were 2-4 degrees C higher than today and sea levels were between 5 and 40 meters higher. The geological record gives us an insight into the long-term physical outcome of current CO2 concentrations. What is does not tell us is the impact on our biosphere, the countless living organisms on which we depend and which is facing an unprecedented rate of change in temperature.
Here in the UK we are deluding ourselves that we reducing our emissions. Although we have cut our direct emissions by 20% according to the Committee on Climate Change, overall UK emissions have actually risen by 10% when we take into account the embodied emissions in the goods we import.
At a global level it would be nice to think that the credit crunch and austerity will at least have a silver lining of decreased damage to our environment. The emissions curve above proves that this is just not so.
This Keeling Curve, shows a sawtooth annual pattern of CO2 concentration rising until a peak in May and then declining gradually until October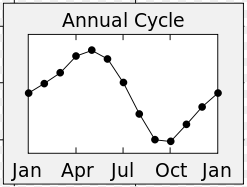 . Why so? The summer decline in CO2 levels is because the majority of the world’s landmass, and hence vegetation, is located in the Northern Hemisphere. As spring and summer arrive plant growth increases dramatically and so the plants take more CO2 out of the atmosphere than we are putting in through human activities. In the autumn and winter this process is reversed as dying leaves release their CO2 back into the atmosphere again. The dips are like breaths in and the rises like the breaths out of our entire planets biosphere.
The problem is that at the end of each cycle the CO2 concentration has risen compared to the previous year. The 400ppm May peaks means that the annual average will, of course, be somewhat lower. Nevertheless the trend upwards has been inexorable, from around 260ppm in pre-industrial times to 315ppm when Keeling first took his measurement to today’s milestone. If you look carefully at the curve you will see that its slope is steepening. Far from bringing emissions under control the indisputable evidence is that whatever we are doing is ineffective. For some, like George Monbiot, it is evidence of how corrupting fossil fuel businesses have managed to undermine any serious effort to curtail emissions.
What is clear from this latest measurement is that something needs to change, and pronto. This brings to mind the quotation, often missattributed to Albert Einstein, “Insanity is doing the same thing over and over again but expecting different results”. Time for us all to reflect. And then to do something different.
For more ideas and challenges check out all the posts on this site.
Learn what an effective resource efficiency framework looks like.
Read reviews of books on the theme of change.
Or learn how SustainSuccess services can drive improvement in your organisation.

0 Comments