 In our earlier discussion of fiduciary duty we have established that it is the duty of private company Directors to enhance the value of their business on behalf of shareholders. One way of achieving this, but by no means the only way, is to increase the profits of the business. We have also seen that resource efficiency offers very large no and low cost savings opportunities for business and that many leading businesses are proving these savings are real. So just what is the connection between efficiency and share price?
Let’s use an example to illustrate this, with simple numbers. Suppose our company Widgets Inc. has sales of US$100m, on which it makes a profit of US$10m. The share price is trading at a sector-average multiplier of 8 times earnings so the company’s total stock is worth US$80m (8 times US$10m profits), and if 10m shares have been issued then each share is worth US$8.00 (US$80m value/10m shares). If we know that the cost of manufacturing is US$50m (the remaining US$40m costs are marketing, distribution, overheads etc.) and that the potential improvement in the manufacturing value added from no/low cost resource efficiency is 5%, then we can calculate the share price impact as follows:
Additional profit from resource efficiency = 5% * US$50m = US$2.5m
Total Profit = US$10m + US$2.5m= US$12.5m
Total enterprise value = 8 * US$12.5m = US$100m
Share Price = US$100m value / 10m shares = US$10.00 per share
Increase in share price = US$10.00 – US$8.00 = US$2.00 / share
Percentage Increase in share price = US$2.00 / US$8.00 = 25%
So, in this very simple example, a reduction in manufacturing costs of 5% (which is equivalent to a decrease in total costs of 2.7%) has led to of 25% share price increase for Widget Inc. If we examine the calculations above we can see that the key driver for that value is that manufacturing costs are 5 times the current profit. In other words the impact of a small percentage cost reduction can be multiplied several times over in terms of impact on share price, according to the following formula:
Or more generally
The important fact to take away from this example is that for businesses where manufacturing costs are greater than the profits (as is the case for most manufacturing businesses) then a given percentage decrease in manufacturing costs will have a greater percentage effect on profit and hence share value. This insight should influence how we interpret Figure 29, as the share value impact may be several multiples of the energy efficiency percentage value added. Later on we shall see in Part 4. 28.1.1 on Financial Valuation that resource efficiency can impact share and other asset values to an even greater extent than the formula above suggests.
Shares, as with other forms of assets, are priced on the investor’s view of the future cash that the investment will generate and the level of risk associated with the investment. Clearly investors appreciate that there are environmental, supply chain, market and other risks associated with resource use, and may therefore be inclined to apply a larger multiple on the share price if they can see that Widgets Inc. is managing its resources better than the average company in its sector and so has a lower risk profile. If the effect of this were to give Widgets Inc. a multiple of 8½ times earnings as a result of visible management of resource risk, then the impact of the resource efficiency improvement of 5% of manufacturing costs would now be almost 33%[1].
Remember DuPont’s US$47m saving from energy efficiency in 2008/09? Well that represented around 0.38% of the Variable Costs of US$12,500m (the closest we have to manufacturing costs in published data) [ DupontData2009 ]. This figure may seem insignificant, but let’s see what that could mean in terms of share value, using the above formula plugging in the 2009 profits before interest and tax (called EBIT) of US$2,578m:
While the share price of DuPont in 2009 was influenced by many factors, from the analysis above we can see that the Energy Efficiency efforts in 2008/09 ought to have had a positive impact of around 1.8% or almost 5 times the 0.38% proportion of variable costs affected. As in the earlier example, this is because the variable costs are almost 5 times the declared profits.
Rearranging the formula above, and eliminating the Manufacturing Costs term, we get an alternative means of determine percentage impact of the resource efficiency program on share value, by using just the $ savings and the $ profits:
If the organisation has a target to increase sales, it may also make sense to describe the effect of the resource efficiency savings in terms of the equivalent sales required to achieve the same profit impact. In the case of DuPont, the 2009 profit (EBIT) of US$2,578m was earned on sales of US$26,109m hence we can calculate the sales equivalent of the energy efficiency efforts as:

In other words, to earn the US$47m saved from energy efficiency DuPont would have had to sell US$476m more of product (with all the marketing and cashflow implications that would involve)! Saying that the energy efficiency program is equivalent to almost “half a billion dollars of sales” will certainly have impact.
For organisations in the public or not-for profit sector, this share value focus may appear irrelevant. However there is an equivalent multiplier effect in terms of service delivery which relates to the marginal cost or the proportion of fixed costs to variable costs in their organisation. Let us consider a hospital. There a number of fixed costs – like the maintenance costs, heating and lighting, administration services and so forth which are generally unaffected by patient numbers. Then there are variable costs like the drugs bill, patient catering costs etc. which directly depend on the number of patients being treated. Finally there are some costs which are called semi-variable, such as nursing costs which are unlikely to rise immediately if just a few additional patients are admitted but would do so once a certain level was exceeded (e.g. through the employment of additional agency staff).
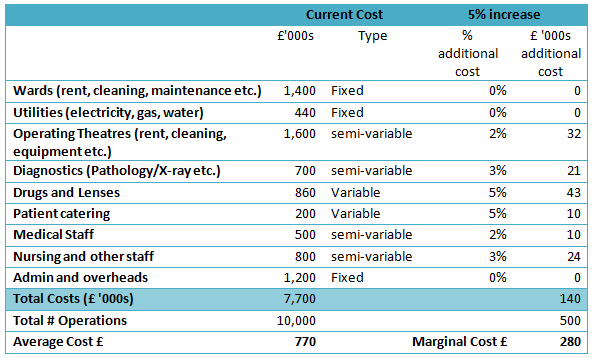
Let’s imagine a fictitious eye-surgery unit in a hospital which carries out an average of 10,000 cataract operations a year (this is a good example as it is the most common operation in the UK totalling 260,000 treatments a year at a cost of £200m – an average of £770 per treatment in 2006). If we consider the costs to run the hospital unit, shown in Figure 33, we can see that, there are some fixed, some semi-variable and some variable costs which altogether add to £7.7m (or our average of £770 per treatment). In order to arrive at a marginal cost, we consider how these costs will rise if we increase our patient numbers by, say, 500 or 5%. We can see that for the variable cost elements, the costs will rise by the full 5% while for some of the fixed-cost elements there may be no cost increase at all (e.g. Ward Costs are largely determined by the rent rather than the number of occupied beds), and the semi variable costs will rise, but not by the full 5%. We can then add up these costs and see that the total is £140,000 to treat the additional 500 patients or just £280 per treatment. This marginal cost of £280 is considerably lower than the average costs per treatment of £770 because some cost elements do not rise with a modest increase in patient numbers (although clearly a substantial increase such as a doubling of numbers could mean that some costs we have considered fixed would also increase – e.g. new Wards would need to be built).

Figure 34 Fictitious cost breakdown for a UK eye surgery unit treating 10,000 patients a year. Alongside the current costs an estimate is made of the incremental cost to treat an additional 500 (5%) patients, from which a marginal cost can be established.
So what does this mean for our resource efficiency business case? Well let’s imagine that we can reduce the utilities cost of this eye hospital by 20% that would be worth £88,000. Although this is a saving of just 1.14% of the total £7.7m cost of the hospital, we could actually deliver £88,000/£280 or 314 additional treatments for this sum, an increase of 3.14%. Thus the service delivery impact of resource efficiency is multiplied wherever the marginal cost of additional service provision is lower than the overall average cost. The formula to use is:
There are many types of public services in addition to healthcare where there is a considerable fixed cost element: for example in education (schools, colleges and universities), in social services, in policing, in public administration or in voluntary sector organisations. If it is suspected that the marginal cost of service delivery is below the current average cost, then it makes sense to calculate the additional service provision made possible by resource efficiency on a marginal cost basis, rather than an average cost basis. We should note, of course, that the same marginal cost effects apply in private sector organisations and if we are building a resource efficiency business case around increased output or production, then we should do so around a marginal cost per unit output rather than the average cost per unit of output. Naturally this marginal cost depends on the size of the increase in production and factors such as the utilisation or capacity of existing plant.


0 Comments